Fig. 2.
Download original image
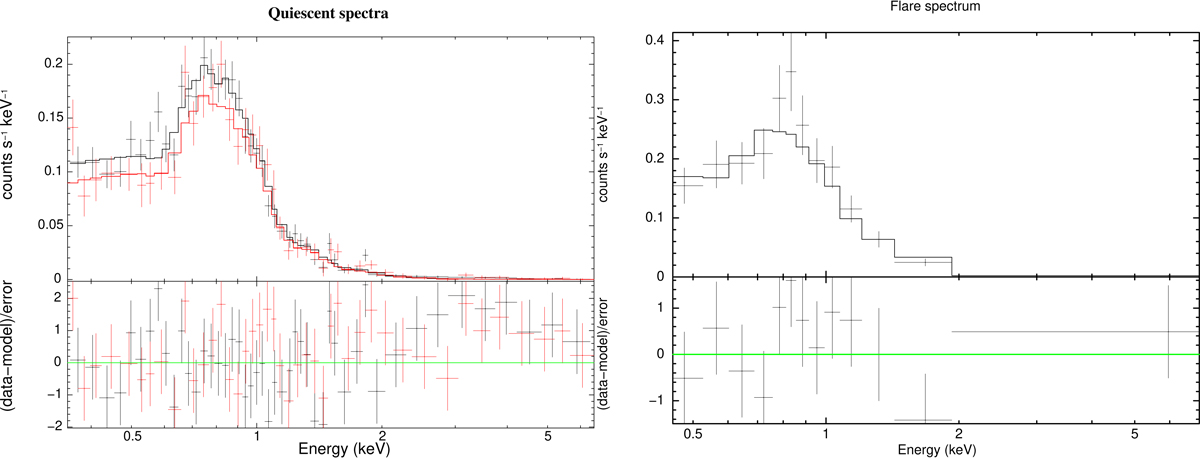
XMM-Newton EPIC spectra of KELT-24 acquired at different activity phases. Left: spectra obtained in the first (red) and second observation (black) during quiescent intervals. The bottom panel shows the contributions to χ2 in units of standard deviations. The model is composed of two absorbed APEC thermal components (dotted lines). Right: same but for the spectrum of KELT-24 acquired during the flare.
Current usage metrics show cumulative count of Article Views (full-text article views including HTML views, PDF and ePub downloads, according to the available data) and Abstracts Views on Vision4Press platform.
Data correspond to usage on the plateform after 2015. The current usage metrics is available 48-96 hours after online publication and is updated daily on week days.
Initial download of the metrics may take a while.