Fig. 1.
Download original image
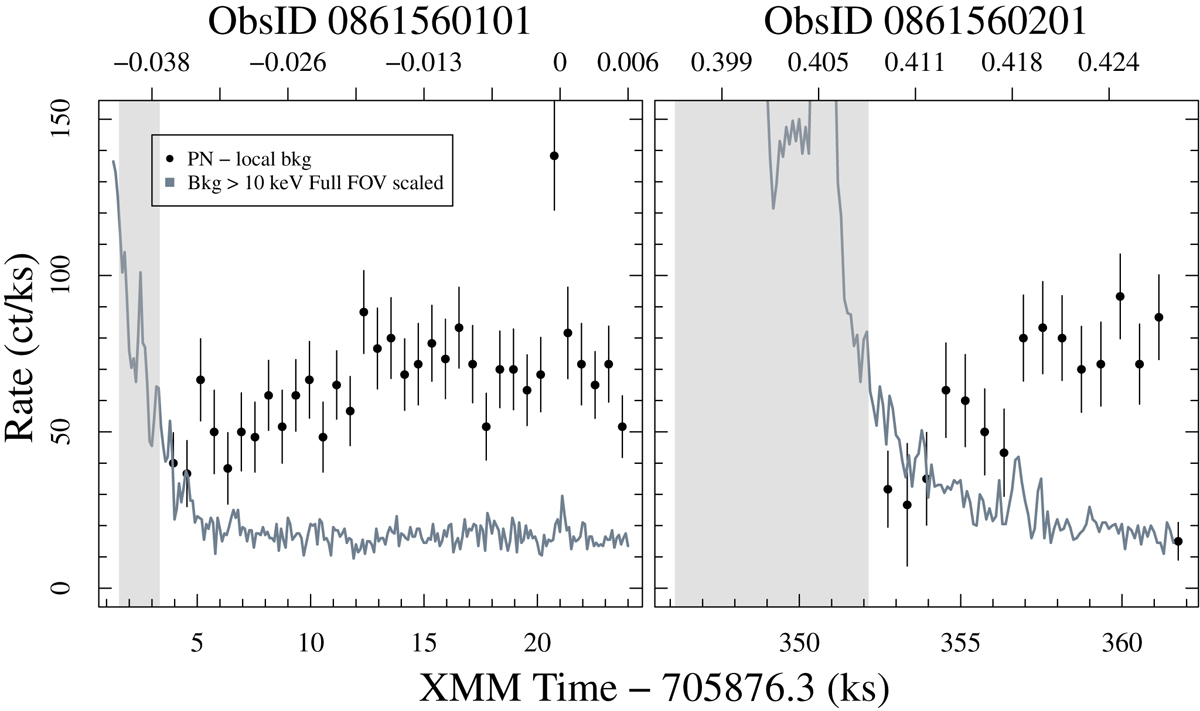
pn light curves of KELT-24 obtained in the first (left panel) and second observation (right panel). The two time series are the net rate of the star (black symbols) and the background at energies above 10 keV (gray curve). Error bars at the 1 sigma confidence level are shown. The X-axis at the bottom indicates the time elapsed since the beginning of the first observation. On the top axis we mark the planetary phases of the primary transit. The gray areas show the time intervals of high background excluded from the analysis.
Current usage metrics show cumulative count of Article Views (full-text article views including HTML views, PDF and ePub downloads, according to the available data) and Abstracts Views on Vision4Press platform.
Data correspond to usage on the plateform after 2015. The current usage metrics is available 48-96 hours after online publication and is updated daily on week days.
Initial download of the metrics may take a while.