Fig. 7
Download original image
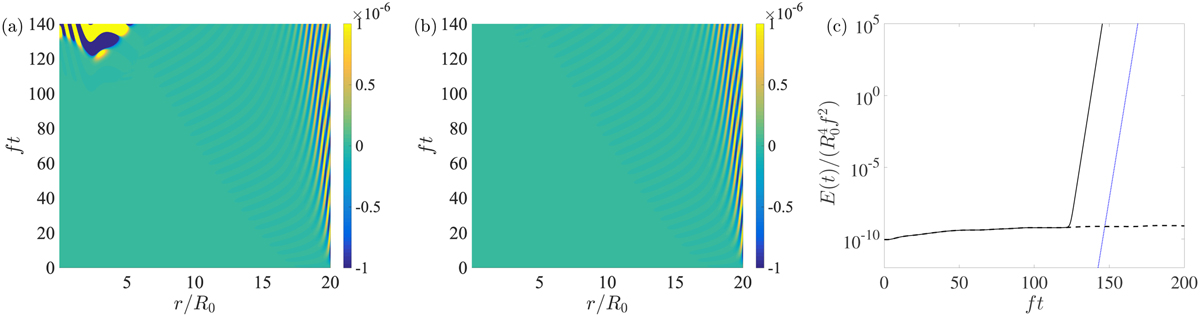
Spatiotemporal diagrams in the space (r, t) for inertial waves entering from r/R0 = 20 at the forcing frequency ωf = 0.3, m = 1, kzR0 = 5, ν = 0 for an unstable column with Ω0/f = 3 (panel a) and a stable column with Ω0/f = 0.5 (panel b). Panel c displays the time evolution of wave energy E(t) for the unstable case (a, black solid line) and stable case (b, black dashed line). The blue line denotes the energy growth C exp(2ωit) with a constant C chosen for comparison with the unstable case.
Current usage metrics show cumulative count of Article Views (full-text article views including HTML views, PDF and ePub downloads, according to the available data) and Abstracts Views on Vision4Press platform.
Data correspond to usage on the plateform after 2015. The current usage metrics is available 48-96 hours after online publication and is updated daily on week days.
Initial download of the metrics may take a while.