Open Access
Fig. 3
Download original image
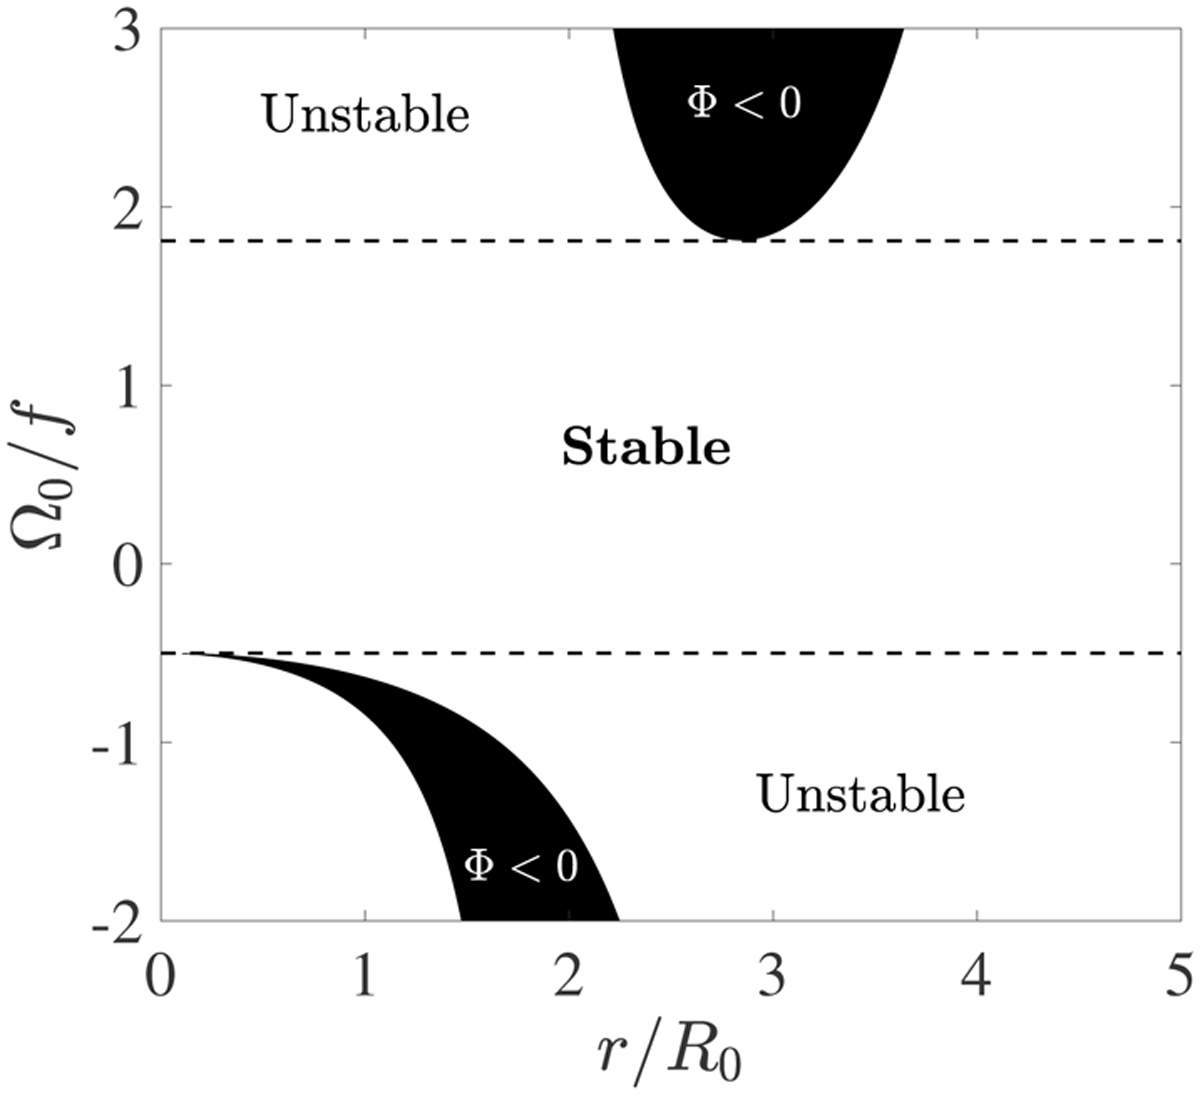
Sign of the Rayleigh discriminant Φ(r) in the parameter space (r/R0, Ω0/f) where black regions indicate Φ < 0 and white regions indicate Φ ≥ 0. Upper and lower dashed lines represent the upper limit (Ω0/f = 1.81) and the lower limit (Ω0/f = −0.5) that bound the cen-trifugally stable region.
Current usage metrics show cumulative count of Article Views (full-text article views including HTML views, PDF and ePub downloads, according to the available data) and Abstracts Views on Vision4Press platform.
Data correspond to usage on the plateform after 2015. The current usage metrics is available 48-96 hours after online publication and is updated daily on week days.
Initial download of the metrics may take a while.