Fig. A.3
Download original image
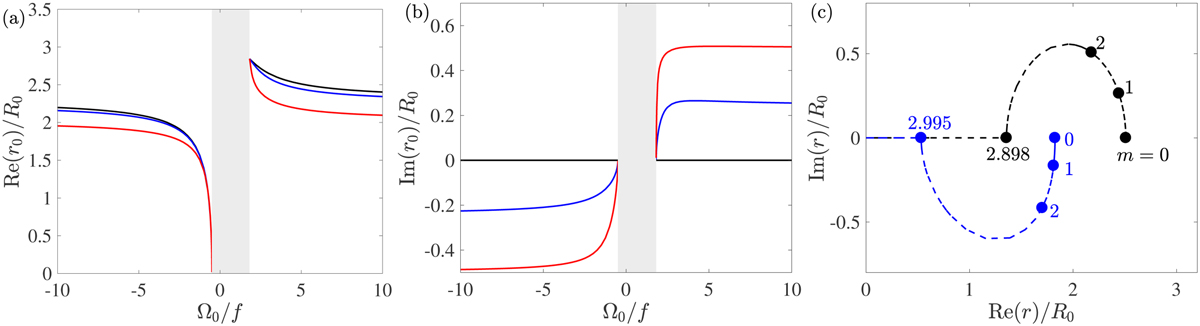
Real and imaginary parts of the double turning point r0 versus Ω0/f for different azimuthal wavenumbers: m = 0 (black), m = 1 (blue) and m = 2 (red; panels a and b). Gray-shaded areas represent the centrifugally stable regime. Panel c displays the movement of the double turning point r0 in the complex plane as m changes for Ω0/f= 5 (black) and Ω0/f= −2 (blue).
Current usage metrics show cumulative count of Article Views (full-text article views including HTML views, PDF and ePub downloads, according to the available data) and Abstracts Views on Vision4Press platform.
Data correspond to usage on the plateform after 2015. The current usage metrics is available 48-96 hours after online publication and is updated daily on week days.
Initial download of the metrics may take a while.