Fig. A.2
Download original image
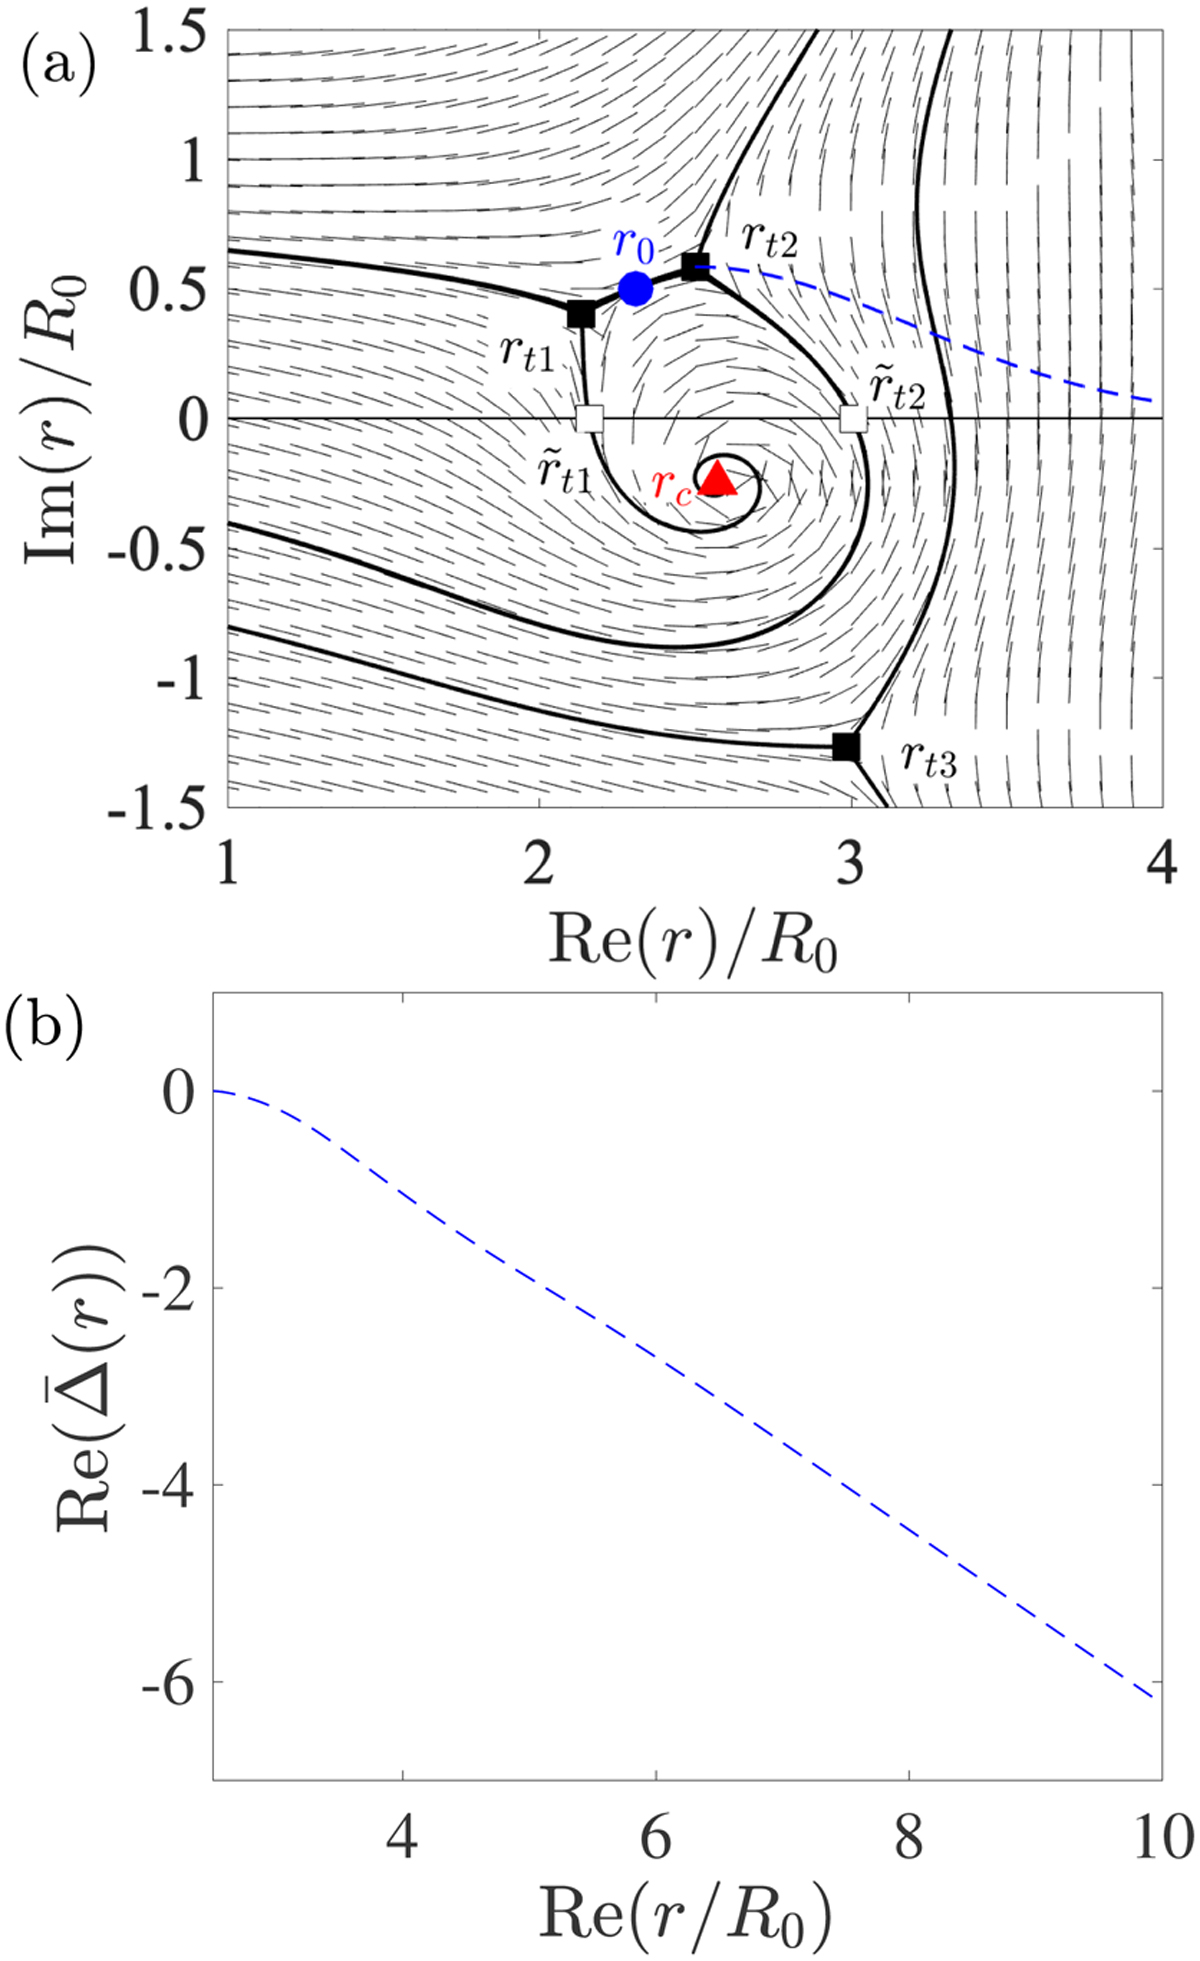
An example of the Stokes lines network for ω = 0.778 + 0.46i at m = 2, kzR0 = 30, and Ω0/f = 3 (panel a). Black solid lines denote the Stokes lines, short lines indicate the direction where Re(Δ) remains constant, and a blue-dashed line denotes the progressive path. Panel b shows he integral versus the real part of r along the progressive path in (a).![]()
Current usage metrics show cumulative count of Article Views (full-text article views including HTML views, PDF and ePub downloads, according to the available data) and Abstracts Views on Vision4Press platform.
Data correspond to usage on the plateform after 2015. The current usage metrics is available 48-96 hours after online publication and is updated daily on week days.
Initial download of the metrics may take a while.