Fig. A.1
Download original image
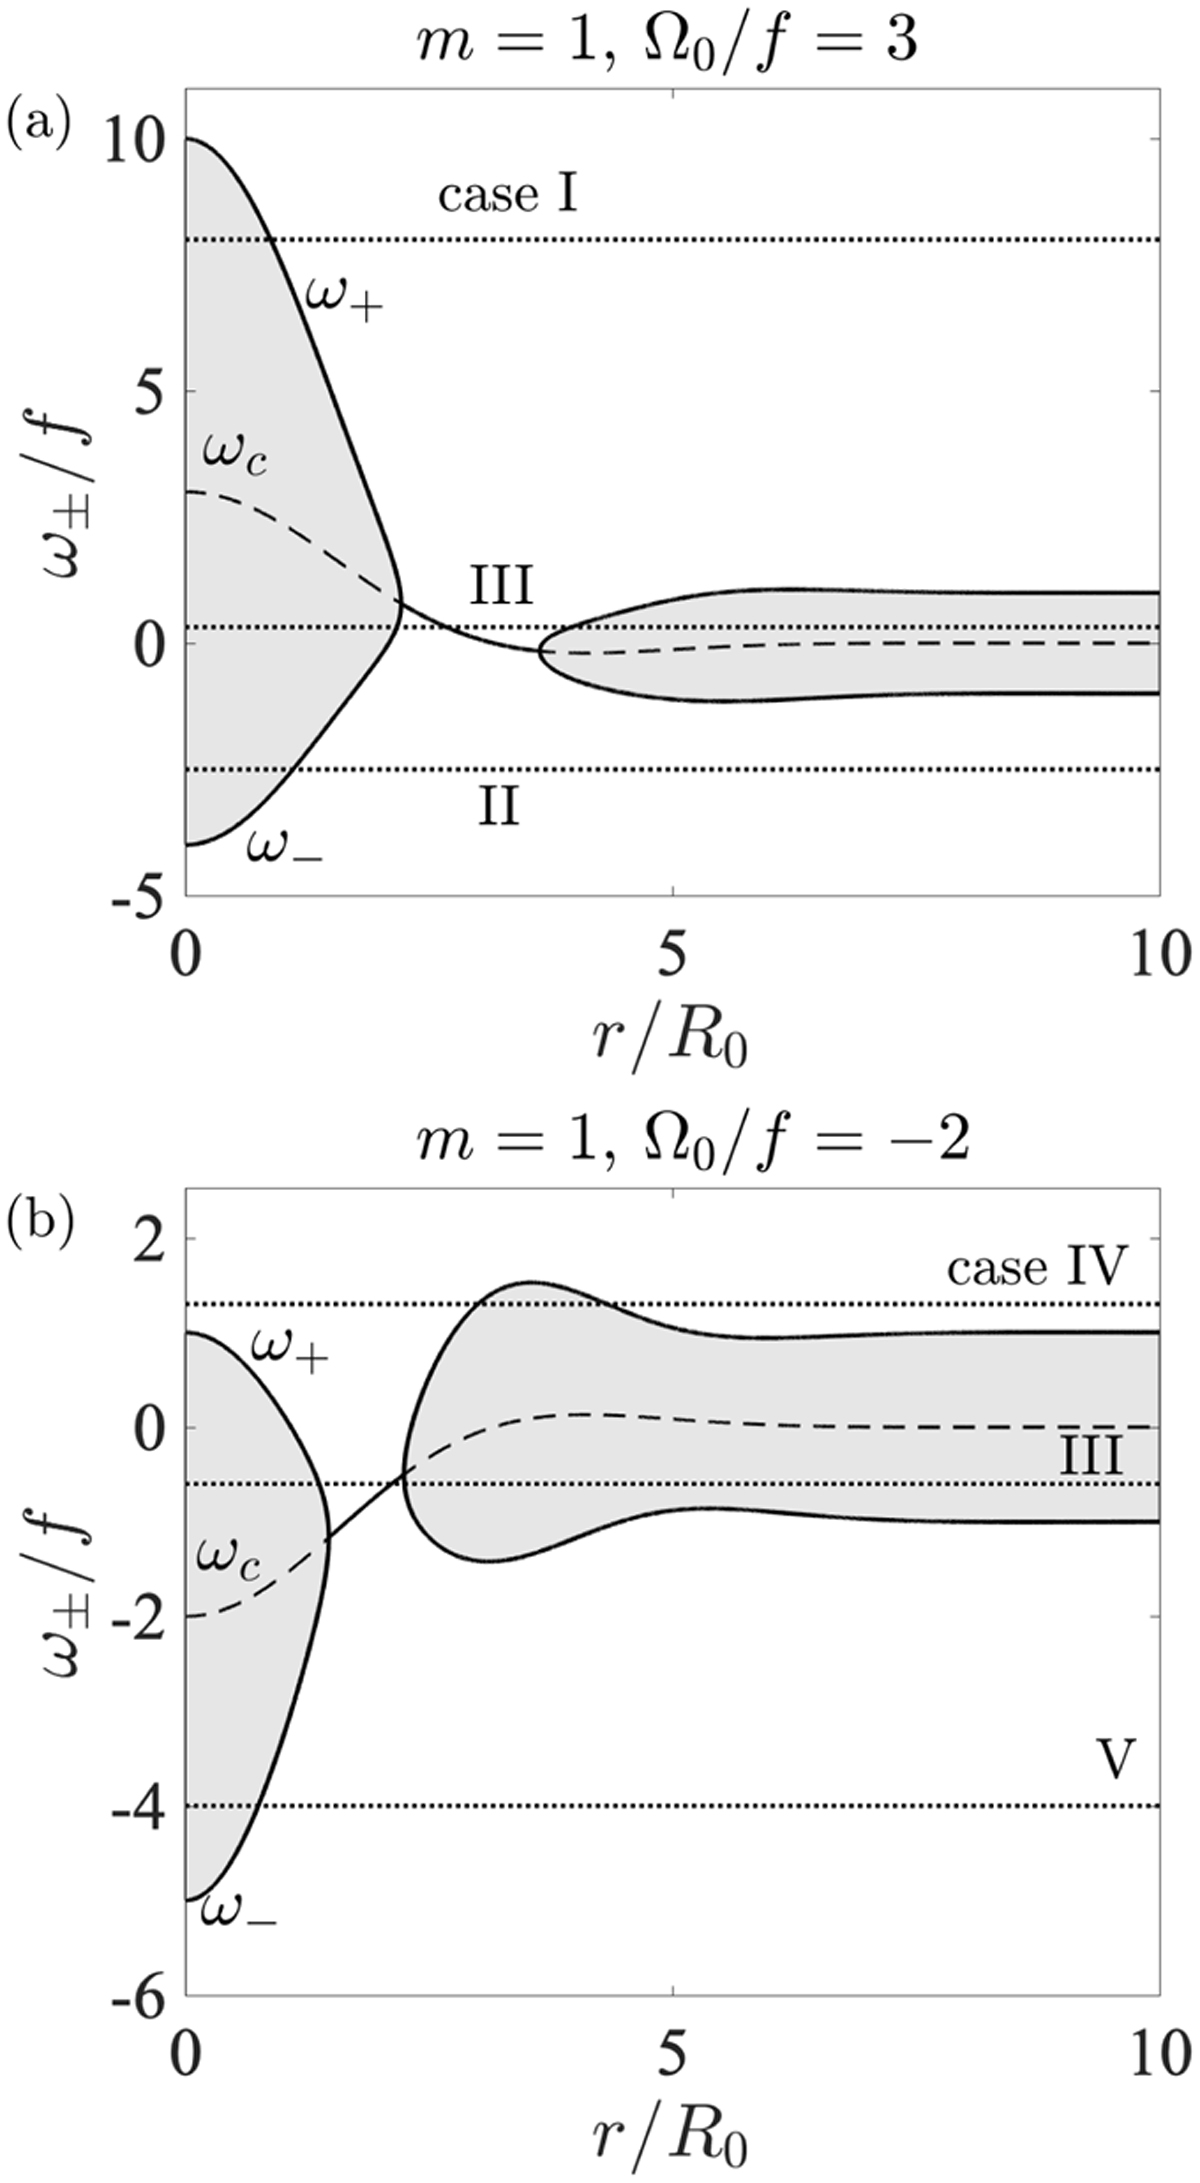
Epicyclic frequencies ω± (solid lines) and critical frequency ωc (dashed line) for m = 1 and (a) Ω0/f = 3 and (b) Ω0/f = −2. The gray area denotes the region where the solution is wave-like (i.e., Δ < 0), while the white area is the evanescent region (i.e., Δ > 0). Dotted lines represent frequencies ωr for neutral modes in the upper (cases I and IV) and lower (cases II and V) branches, and for unstable modes (case III).
Current usage metrics show cumulative count of Article Views (full-text article views including HTML views, PDF and ePub downloads, according to the available data) and Abstracts Views on Vision4Press platform.
Data correspond to usage on the plateform after 2015. The current usage metrics is available 48-96 hours after online publication and is updated daily on week days.
Initial download of the metrics may take a while.