| Issue |
A&A
Volume 672, April 2023
|
|
|---|---|---|
| Article Number | L8 | |
| Number of page(s) | 6 | |
| Section | Letters to the Editor | |
| DOI | https://doi.org/10.1051/0004-6361/202346335 | |
| Published online | 14 April 2023 | |
Letter to the Editor
The formation history of our Galaxy’s nuclear stellar disc constrained from HST observations of the Quintuplet field
1
Instituto de Astrofísica de Andalucía (CSIC), Glorieta de la Astronomía s/n, 18008 Granada, Spain
e-mail: This email address is being protected from spambots. You need JavaScript enabled to view it.
2
European Southern Observatory, Karl-Schwarzschild-Strasse 2, 85748 Garching bei München, Germany
3
Department of Physics and Astronomy, University of California, Los Angeles, CA 90095, USA
4
Department of Astronomy, University of California, 501 Campbell Hall, Berkeley, CA 94720, USA
Received:
6
March
2023
Accepted:
31
March
2023
Abstract
Context. Until recently it was thought that the nuclear stellar disc at the centre of our Galaxy was formed via quasi-continuous star formation over billions of years. However, an analysis of GALACTICNUCLEUS survey data indicates that > 80% of the mass of the stellar disc formed at least 8 Gyr ago and about 5% roughly 1 Gyr ago.
Aims. Our aim is to derive new constraints on the formation history of the nuclear stellar disc.
Methods. We analysed a catalogue of HST/WFC3-IR observations of the Quintuplet cluster field. From this catalogue, we selected about 24 000 field stars that probably belong to the nuclear stellar disc. We used red clump giants to deredden the sample and fit the resulting F153M luminosity function with a linear combination of theoretical luminosity functions created from different stellar evolutionary models.
Results. We find that ≳70% of the stellar population in the nuclear disc probably formed more than 10 Gyr ago, while ∼15% formed in an event (or series of events) ∼1 Gyr ago. Up to 10% of the stars appear to have formed in the past tens to hundreds of Myr. These results do not change significantly for reasonable variations in the assumed mean metallicity, sample selection, reddening correction, or stellar evolutionary models.
Conclusions. We confirm previous work that changed the formation paradigm for stars in the Galactic Centre. The nuclear stellar disc is indeed a very old structure. There seems to have been little star formation activity between its formation and about 1 Gyr ago.
Key words: Galaxy: center / Galaxy: nucleus / Galaxy: stellar content / Galaxy: formation
© The Authors 2023
 Open Access article, published by EDP Sciences, under the terms of the Creative Commons Attribution License (https://creativecommons.org/licenses/by/4.0), which permits unrestricted use, distribution, and reproduction in any medium, provided the original work is properly cited.
This article is published in open access under the Subscribe to Open model. This email address is being protected from spambots. You need JavaScript enabled to view it. to support open access publication.
1. Introduction
The Galactic Centre is marked by the presence of the nuclear stellar disc (NSD), a dense, flat, rotating stellar structure of roughly one billion stars, aligned with the Galactic plane, with exponential scale lengths of about 90 pc in the radial direction and 30 pc in the vertical direction (Sormani et al. 2022). It probably formed from gas transported to the centre through the Galactic bar, in a similar way to nuclear discs in other galaxies (Gadotti et al. 2020; Bittner et al. 2020).
The Galactic Centre is observationally challenging (see Sect. 2 in Schödel et al. 2014b). Due to the extreme crowding of stars, studies of its stellar population should be carried out with angular resolutions ≲0.2″, that is, either from space, with the HST or JWST, or from the ground, with speckle or adaptive optics techniques. Due to the high interstellar extinction toward the Galactic Centre, sensitive observations are mostly restricted to the wavelength range ≳1.5 μm, where intrinsic stellar colours are small. Since extinction also varies on arcsecond scales, it is extremely difficult to use colours to distinguish between different types of stars, but the observed colours can serve to deredden the observed stellar magnitudes. As a result, studies of the star formation history of the Galactic Centre either use high angular resolution integral field spectroscopy to investigate small regions, such as the central parsec (e.g., Pfuhl et al. 2011; Chen et al. 2023), or they rely on the analysis of luminosity functions, when studying large areas photometrically (Figer et al. 2004; Nogueras-Lara et al. 2020; Schödel et al. 2020).
Figer et al. (2004) carried out the first study to probe the star formation history of the Galactic Centre across several widely dispersed but small fields with HST/NICMOS, and used Gemini adaptive optics data (and also seeing-limited Lick photometry) to analyse luminosity functions. They found the data to be consistent with continuous star formation at an average rate of 0.01 M⊙ yr−1. They did not distinguish between different structures at the Galactic Centre, such as the nuclear star cluster, the NSD, and the inner bar region, probably because our knowledge about these different structures was still very limited at the time.
The next investigation of the star formation history of the Galactic Centre on large scales, specifically of the NSD was carried out by Nogueras-Lara et al. (2020). They used 0.2″ angular resolution data from the GALACTICNUCLEUS survey, the most complete survey of the Galactic Centre region to date (Nogueras-Lara et al. 2019). They studied a 90 pc × 30 pc field, centred on Sagittarius A*, but omitted the nuclear star cluster due to its excessive crowding. They found that ≳80% of the stellar mass formed at least 8 Gyr ago, followed by a long quiescent period that was ended by a strong star formation event ∼1 Gyr ago, when about 5% of the stellar mass formed. Up to a few precent of the stars formed in the past few 100 Myr.
In this work we follow up the work by Nogueras-Lara et al. (2020) and study the star formation history in the NSD with a fully independent data set. We chose to use HST WFC3-IR data on a ∼2′×2′ field centred on the Quintuplet young massive cluster, which is located at a projected distance of about 30 pc from the central black hole, Sagittarius A*, very nearly on the Galactic plane: (l, b) = (0.164, −0.0602) deg. The field is located far outside the half-light radius of the nuclear star cluster (∼4 pc Schödel et al. 2014a; Feldmeier-Krause et al. 2017), so that we do not have to worry about contamination of the stellar population from the nuclear cluster Rui et al. (2019) had reported on the presence of a potential secondary red clump (RC) in the colour-magnitude diagram (CMD) of this region, similar to what was reported by Nogueras-Lara et al. (2020) in their study of the star formation history of the NSD. Hosek et al. (2022) published a catalogue containing ∼40 000 stars in this field, with F153M, F139M, and F127M magnitudes and precision proper motions. The kinematic information allows us to clean the data from young stars that belong to the Quintuplet cluster and also to minimise pollution from interloping inner Galactic bar stars.
2. Data
We use the catalogue from Hosek et al. (2022), but without any cuts applied to proper motion uncertainties so as to increase completeness at the faint end of the luminosity function. We show the corresponding F153M vs. F127M − F153M CMD in Fig. 1. The CMD is rich in features and shows the foreground stellar population (blue), stars in the Quintuplet cluster (green), and stars that belong to the surrounding Galactic Centre population (brown). In the following we use term field population for the Galactic Centre population that does not belong to the Quintuplet. The proper motion vector point diagram in Fig. 2 shows the flattened shape expected for the NSD, surrounded by a more spherical distribution that corresponds to the stars from the inner bar (Shahzamanian et al. 2022). Finally, the Quintuplet cluster stands out as a clear overdensity in proper motion space.
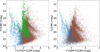 |
Fig. 1. Colour–magnitude diagrams for the Quintuplet field. Foreground stars (F127M − F153M < 1.8 mag) are shown in blue, Galactic Centre stars in brown, and probable Quintuplet cluster members (membership probability from proper motions > 50%) as green crosses. Some foreground and background stars move along with the bulk of the Quintuplet and are therefore also shown as green crosses (see Rui et al. 2019). The probable members of the Quintuplet cluster are only shown in the left panel. |
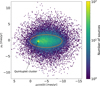 |
Fig. 2. Vector point diagram for the catalogue for the Quintuplet field. The quality cuts of Hosek et al. (2022) have been applied to include only high-quality proper motions in this figure. Shown are the number of sources per proper motion bin, considering the velocities parallel and perpendicular to the Galactic Plane, μb and μlcos(b), respectively. The arrow points to the position of the Quintuplet cluster in proper motion space. The orange ellipse indicates our selection criterion for nuclear stellar disc members. |
In the brightness ranges considered here, foreground stars towards the Galactic Centre can be identified readily via their low reddening (e.g., Nogueras-Lara et al. 2021a). We preprocessed the data by excluding foreground stars (F127M − F153M < 1.8 mag), background stars (stars with very high reddening: F127M − F153M > 2.8 mag), and members of the young Quintuplet cluster (membership probability > 50% according to the catalogue). The remaining field population displays the prominent RC feature, located around F153m ≈ 17.5 and F139M − 153M ≈ 1.3 and elongated along the reddening vector (right panel of Fig. 1).
We studied the luminosity function in the F153M filter, where extinction is least severe for the filters used here and the star counts are consequently the deepest. Since differential reddening washes out the features in the luminosity function, we first dereddened the data. The intrinsic colours of stars in the RC are small and very similar, and are largely independent of metallicity (at least between solar and twice solar) and age (for ages ≳2 Gyr) (Girardi 2016).
We therefore chose RC stars as dereddening stars (see Fig. 3) and assumed intrinsic colours of F127M − F139M = 0.18, F139M − F153M = 0.2, and F127M − F153M = 0.4 (from MIST1 isochrones of metallicity Z = 0.03 and age 3 Gyr; Dotter 2016; Choi et al. 2016; Paxton et al. 2011, 2018). We assumed an extinction curve of Aλ ∝ λ−α with α = 2.1 (Fritz et al. 2011). We computed the mean of the extinction values that resulted from the three different possible filter combinations.
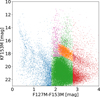 |
Fig. 3. Colour–magnitude diagram. Blue: foreground stars; red: background stars; orange: RC stars used for dereddening; pink: young stars from the Quintuplet cluster. |
Each star in the catalogue was dereddened when there were at least three dereddening stars within a radius of 2.5″. We used the median of the extinction values corresponding to the dereddening stars. Similar dereddening methods were applied by Schödel et al. (2010) and Nogueras-Lara et al. (2021b), among others. Due to the distribution of stars along the line of sight and the small-scale variable extinction towards the Galactic Centre, this dereddening method will produce some outliers. After dereddening, we deselected the outliers by excluding all stars > 2.5σ to the red or blue side of the median of the dereddened F139M − F153M CMD, along the reddening line.
The original catalogue had 46 087 stars detected in F153M. After applying all the above-described selection criteria, we were left with 24017 stars. In Fig. 4 we show the measured and dereddened CMDs as well as the measured and dereddend luminosity functions.
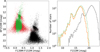 |
Fig. 4. Observed (black) and dereddened (green) CMDs and luminosity functions. Excluded outliers are shown in red in the CMD. At faint magnitudes the green ‘cloud’ becomes narrower because of the systematics of the outlier estimation (red sources drop out). This does not have any influence on our analysis, because these faint stars lie several magnitudes below our completeness cut-off. The orange luminosity function excludes the outliers after dereddening. |
Nuclear stellar disc stars and stars from the innermost Galactic bar will occupy the same space, although the fraction of the latter will be below 25% at the location of the Quintuplet (see Fig. 10 in Sormani et al. 2022). According to the analysis of Shahzamanian et al. (2022) the velocity dispersion of stars in the NSD is σ⊥ = 1.5 mas yr−1 (σ∥ = 2.0 mas yr−1) in the direction perpendicular (parallel) to the Galactic plane. The velocity dispersion of bar stars is close to isotropic with σBar ≈ 3 mas yr−1. We suppress any potential contamination by bar stars further by selection in velocity space. We chose as NSD sample the stars inside an ellipse centred on the mean proper motions, with a half width of 5.0 mas yr−1 and a half height of 2.0 mas yr−1, parallel and perpendicular to the Galactic plane, respectively (orange ellipse in Fig. 2). As can be seen in Fig. 9 of Shahzamanian et al. (2022), we thus cut off the high-velocity tail of the bar stars. Our criterion is admittedly somewhat arbitrary, but our results are hardly sensitive to the exact choice of the selection criterion in velocity space (see discussion of systematics below).
Completeness. At the angular resolution of the used observations, completeness is dominated by crowding. We used the critical distance method (see e.g., Eisenhauer et al. 1998; Harayama et al. 2008). We found that completeness was close to 100% up to an observed magnitude of F153M = 17, dropped to 76% at F153M = 20 and to 42% at F153M = 21. We limited our analysis to stars brighter than an observed magnitude of F153M = 20.5 (about F153M = 15.5 after extinction correction) and applied the estimated completeness correction to all star counts, assuming a 5% uncertainty in the estimated completeness levels. Since we are limited by crowding and the observations are sufficiently sensitive, the completeness at F127M is almost identical to that at F153M, which can be seen in the CMD in the left panel of Fig. 1, which does not show any colour-dependent cut-off at faint magnitudes.
3. Star formation history of the NSD
We fitted the cumulative luminosity function of our sample with theoretical luminosity functions. Using the cumulative function avoids biases due to the choice of the bin width. We assumed a linear combination of 19 ages: 20, 50, 100, 200, 400, 600, 800, 1000, 1500, 2000, 3000, 4000, 5000, 6000, 7000, 8000, 9000, 11 000, and 13 000 Myr to cover the full range of expected ages. The luminosity functions vary more rapidly in time for younger ages, which is the reason why we chose a tighter spacing of ages below 3 Gyr. The weight of all ages was initially set to zero. The fit converged well and experiments with random starting values showed that the fit (minimum χ2 with the Levenberg-Marquardt gradient descent method) did apparently not get stuck in relative minima. The theoretical luminosity functions were created from Basti2 (Hidalgo et al. 2018; Pietrinferni et al. 2021), PARSEC3 (Bressan et al. 2012; Chen et al. 2014; Tang et al. 2014; Marigo et al. 2017; Pastorelli et al. 2020), and MIST isochrones, assuming a solar-scaled metallicity of Z = 0.03 (Schultheis et al. 2021; Nogueras-Lara 2022) and a Salpeter initial mass function. A different choice of initial mass function had no discernible effect because our sample consists almost entirely of giant stars in a narrow mass interval of about 1 − 2 M⊙ (see also discussion in Schödel et al. 2020). Additional parameters to optimise the fit were residual extinction and a Gaussian smoothing parameter (to take into account effects such as measurement uncertainties, remnant scatter from the imperfect reddening correction, the line-of-sight extent of the NSD, or luminosity shifts between the theoretical models; see Schödel et al. 2020). The best fit for MIST isochrones is shown in Fig. 5. We limited the fit to dereddened magnitudes F153M ≤ 15.5, where completeness is ≳70%.
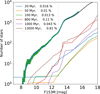 |
Fig. 5. Fit of cumulative theoretical luminosity functions to the measured cumulative luminosity function of the NSD (data: black; data after completeness correction and including error bars: green; best fit: blue). Theoretical functions of all stellar population that contribute more than 1% of originally formed stellar mass are colour-coded (see inset). |
Since our data are limited in brightness, the main features in the luminosity function that guide the convergence of the fits are the cut-off at bright magnitudes, the asymptotic giant branch (AGB) bump, the RC bump (RCB), and the red giant branch bump (RGBB). All models differ in the separation between the RCB and RGBB and its evolution with age. In Fig. 6 we show the luminosity functions between the AGB and the RGBB for PARSEC, MIST, and the new and old (2014) Basti releases. PARSEC, MIST, and the 2014 release of Basti models appear generally similar. Differences are apparent in the magnitudes, shape, and time evolution of the RCB and RGBB peaks. The evolution of the RGBB is inverse in PARSEC, as compared to MIST and Basti, that is it becomes brighter with age instead of fainter. The new Basti release produces markedly different luminosity functions than the other three models. The RGBBs lie much closer to the RCB than in the other models and the RCB is shifted to fainter magnitudes than in the other three models. Because of this disagreement, we chose to use the old Basti release in our analysis, but also show the Monte Carlo results (see below) for the newer model.
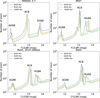 |
Fig. 6. Comparison between theoretical luminosity functions in the region around the asymptotic giant branch bump (AGBB), RC bump (RCB) and the red giant branch bump (RGBB) for the MIST, PARSEC, and Basti (current and 2014 release) evolutionary codes. The AGB, RC, and RGB bumps are key features used to constrain the star formation history from luminosity functions. The stellar magnitudes assume no extinction, but a distance modulus of 14.51 mag. |
3.1. Monte Carlo simulations
To constrain the distribution of possible solutions we carried out Monte Carlo (MC) simulations with full sample bootstrap resampling of the selected NSD stars and 100 iterations. The frequency histograms are shown in Fig. 7. The results of all simulations are similar, but show some differences with respect to the underlying assumed stellar evolution model. In all cases there are two clear peaks; the first indicates that ∼80% of star formation took place > 10 Gyr ago and the second shows that up to 20% of the stellar mass formed around 0.8–1.5 Gyr (MIST, PARSEC) or 0.4–0.6 Gyr (Basti) ago. There are no unambiguous signs of activity at intermediate ages. Up to 10% of the stars may have formed in the past 100 Myr.
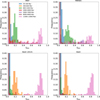 |
Fig. 7. Observed frequencies of different age bins in the MC simulation of the star formation history. The different panels correspond to different stellar evolution models, as labelled. |
3.2. Best fits and their systematics
In addition to the MC modelling, we inferred the best fit star formation histories under different assumptions and checked the following sources of systematic uncertainty:
1. Theoretical models: We compared the Basti (2014 release), MIST, and PARSEC models.
2. Cut-off of the luminosity function at the faint end: The luminosity function becomes incomplete at faint magnitudes. The faint magnitude cut-off in the fitting of the luminosity functions can be important because, on the one hand, incomplete star counts may introduce a bias and, on the other hand, a fainter magnitude cut-off provides better constraints on the main sequence turn-off of certain populations. We fit the models for faint cut-offs at F153M = 15.5 (the default) as well as F153M = 15.0 and F153M = 16.0 mag (extinction corrected magnitudes).
3. Metallicity: 1.5 times solar (default), solar, and twice solar.
4. Outlier rejection after dereddening: We performed the fit for 3σ, 2.5σ (default), and 2.0σ clipping.
5. Foreground star rejection: In addition to the default value F127M − F153M = 1.8 mag, we also used 1.7 and 1.9 mag.
6. Background star rejection: In addition to the default value F127M − F153M = 2.8 mag, we also tested 2.6 and 3.0 mag.
7. Different dereddening radii: 1.5″, 2.5″, and 3.5″.
8. Different rejection probabilities for Quintuplet cluster stars: 0.5 (default), 0.3, and 0.7.
9. Different selection of NSD stars: using, on the one hand, the stars inside an ellipse centred on the mean proper motions with a half width of 4.0 mas yr−1 and a half height of 1.5 mas yr−1, and, on the other hand, a half-width of 6.0 mas yr−1 and a half-height of 2.5 mas yr−1. We also ran the fit using no velocity selection criterion, finding that this criterion had a negligible effect on our model fitting.
10. Binarity: The PARSEC models include Kroupa initial mass functions that are corrected for binarity. We used those binary-corrected luminosity functions. We also used the SPISEA code (Hosek et al. 2020) to prepare MIST luminosity functions that include unresolved binaries. We did not note any significant differences of the results with respect to the fits that do not take binarity into account.
We found the clearest differences between the different stellar evolutionary codes, as can be seen in the left panel of Fig. 8, that shows means and uncertainties across all assumptions, but shows those separately for the different evolutionary codes. In particular, PARSEC models tended to result in more solutions with some presence of star formation at intermediate ages, as can also be seen in the MC simulations (Fig. 7). Basti models also show an age-shift compared to MIST and PARSEC: The strong star formation event that appears 0.8–1.5 Gyr for the latter two models appears at 0.6–0.8 Gyr in the Basti models (see also Nogueras-Lara et al. 2020). The right panel of Fig. 8 provides an overview of the overall star formation history, averaged over different evolutionary models and systematic assumptions. The result of our investigation of systematics is consistent with the results from the MC simulations shown in Fig. 7.
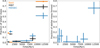 |
Fig. 8. Star formation history of the NSD based on the mean and standard deviations of the best fits to the cumulative F153M luminosity function, testing different sources of systematic uncertainties (see text). Left: resulting star formation history for different evolutionary models (blue: PARSEC; black: MIST; orange: Basti). Right: mean star formation history across all models and systematic assumptions. |
3.3. Star formation history in the Quintuplet field
We find the following star formation history for the field population in the Quintuplet field. About two-thirds of the stars formed at an age of 11 − 13 Gyr. Star formation activity was very low between 2 and 10 Gyr ago. There was a clear phase of very high activity about 1 Gyr ago, when about 15% of the total stellar mass formed. Up to 10% of the stellar mass may have formed in the past few 100 Myr.
4. Discussion and conclusions
In this work we followed up the secondary RC feature in the Quintuplet field that was reported and discussed, but not investigated in depth, by Rui et al. (2019). A double RC feature was also reported for the entire inner Galactic Centre region by Nogueras-Lara et al. (2020) and interpreted compellingly as a sign of intense star formation roughly 1 Gyr ago. We fit the F153M luminosity functions of the Quintuplet field with theoretical models, based on the PARSEC, Basti, and MIST evolutionary codes. Both the MC simulations and the repeated best fits with a broad range of assumptions on systematic factors such as extinction correction, metallicity, or faint luminosity cut-off, provide us with a consistent picture: at least two-thirds of the stars formed > 10 Gyr ago. This initial phase was followed by a period of negligible star formation until about 2 Gyr ago. Subsequently, about 800 Myr to 1 Gyr ago, of the order of 15% of the stellar mass in this region were formed, while up to 10% may have formed in the past few 100 Myr, with a clearly increased rate of star formation in the last tens of millions of years.
The systematic differences between the stellar evolutionary models that we have found here opens up the exciting possibility that we may be able to calibrate these models observationally in the NSD if its star formation history can be verified independently, for example through spectroscopy. Stellar evolution models are also poorly constrained by observational data at high metallicities. The Galactic Centre thus offers an excellent opportunity to calibrate such models.
The star formation history that we find for the field (i.e., non-cluster) population in the Quintuplet field is consistent, within the uncertainties, with the results of Nogueras-Lara et al. (2020) and Nogueras-Lara et al. (2022), but is fully independent from the latter in important aspects. First, we used a different instrument and different filters. Second, our dereddening method is similar, but markedly different in methodological aspects. In particular, we exploited the three possible colour combinations from three filters instead of a single colour; we did not create an extinction map, but determined reddening for each star individually; and we did not apply any weighting of the dereddening stars as a function of distance (see Methods section in Nogueras-Lara et al. 2020). Third, we fit the cumulative luminosity function, not the binned function, and we developed new code without recycling that used in Nogueras-Lara et al. (2020). Fourth, we used three different stellar evolutionary models and a larger number of age bins. We find a somewhat lower fraction of old stars and a higher fraction of stars formed in the 1 Gyr event than Nogueras-Lara et al. (2020). This may be due to methodological differences, and also to the fact that the field studied here is significantly smaller. There are possbile variations in the population across the NSD, which must be explored by future work.
A limitation of this work is the relatively bright luminosity cut-off that we have to use. Therefore our model fitting has to rely on the locations, shapes, and relative weights of the bright cut-off, the AGB, the RCB, and the RGBB. Simulations have verified the validity of this method (see Nogueras-Lara et al. 2020, 2022). Observations at higher angular resolution are needed to push towards fainter magnitudes, and thus be able to probe the main sequence turn-off of populations of different ages, which would provide powerful new constraints on the star formation history.
Star formation at the Galactic Centre depends upon the availability of gas, which is thought to be funnelled towards this region by the Galactic bar. Therefore, nuclear stellar discs appear to be present in most barred spirals (Gadotti et al. 2020). Dating the formation time of nuclear stellar discs may provide a very good proxy to the formation time of Galactic bars (see Baba & Kawata 2020). Our present analysis suggests an even older formation of our Galaxy’s nuclear stellar disc than Nogueras-Lara et al. (2020). We speculate that the formation of the nuclear stellar disc may coincide with the time when the Milky Way underwent its last major merger about 10 Gyr ago (Helmi et al. 2018; Kruijssen et al. 2020). Nogueras-Lara et al. (2020) pointed out that the 1 Gyr star formation event may be related to the last pericentre passage of the Sgr dwarf galaxy. Related to this idea, Ruiz-Lara et al. (2020) suggested that the Sgr dwarf galaxy may have induced an episode of enhanced star formation 1 Gyr ago in the solar neighbourhood.
The observation that star formation may have been suppressed between the original formation of the nuclear stellar disc and the 1 Gyr event is puzzling because bars are very efficient at transporting gas towards galaxy centres. The Milky Way bar is estimated to provide of the order of 1 M⊙ yr−1 to the Galactic Centre (e.g., Hatchfield et al. 2021). Bars are generally considered to be stable long-lived features, and there is reason to believe that the Milky Way bar is at least 8 Gyr old (e.g., Bovy et al. 2019). An old formation time of the bar is also evidenced by the age of the nuclear stellar disc, as discussed above and inferred from work on Mira variables (Sanders et al. 2022). It therefore appears unlikely that the Milky Way bar was absent for several gigayears.
We can speculate that there was little gas available for star formation in the inner several hundred parsec of the Milky Way during billions of years. Outflows can remove a considerable fraction of gas from the Galactic Centre (see discussion in Henshaw et al. 2022), but either accretion onto Sgr A* or intense star formation are required to drive strong outflows over long periods of time. Since both require gas inflow as well, the driving of outflows over billions of years does not appear to be plausible. Alternatively, gas may have stalled or formed stars at larger radii (e.g., near the edges of the bar).
Finally, Bittner et al. (2020) find that nuclear discs in external galaxies form from the inside out. In this context we note that in their study of the Sgr B1 region, Nogueras-Lara et al. (2022) report tentative evidence that the outer region of the Milky Way’s nuclear disc contains a significant fraction of stars that formed at intermediate ages of 2–7 Gyr. In addition, using proper motion measurements, Nogueras-Lara et al. (2023) report an inside-out age gradient for the nuclear stellar disc along the line of sight. Since the present work and the previous study by Nogueras-Lara et al. (2020) are limited to projected distances of < 50 pc from Sgr A*, this is a likely explanation for the absence of intermediate-age stars in these two studies.
Further progress will require us to study the star formation history in the nuclear disc at larger distances from Sgr A* and to use larger proper motion samples to disentangle the stellar populations. In addition, deeper and higher angular resolution observations of the stellar population will be extremely helpful because they could reach the main sequence turn-off of the oldest populations, and would thus be a highly reliable age indicator.
http://waps.cfa.harvard.edu/MIST/interp_isos.html, version 1.2
http://stev.oapd.inaf.it/cgi-bin/cmd, release 1.25.
Acknowledgments
RS, AMA, AG, EGC, MCG, and ATGC acknowledge financial support from the State Agency for Research of the Spanish MCIU through the “Center of Excellence Severo Ochoa” award for the Instituto de Astrofísica de Andalucía (SEV-2017-0709) and financial support from national project PGC2018-095049-B-C21 (MCIU/AEI/FEDER, UE). M.H. is supported by the Brinson Prize Fellowship. FNL gratefully acknowledges the sponsorship provided by the European Southern Observatory through a research fellowship.
References
- Baba, J., & Kawata, D. 2020, MNRAS, 492, 4500 [NASA ADS] [CrossRef] [Google Scholar]
- Bittner, A., Sánchez-Blázquez, P., Gadotti, D. A., et al. 2020, A&A, 643, A65 [NASA ADS] [CrossRef] [EDP Sciences] [Google Scholar]
- Bovy, J., Leung, H. W., Hunt, J. A. S., et al. 2019, MNRAS, 490, 4740 [Google Scholar]
- Bressan, A., Marigo, P., Girardi, L., et al. 2012, MNRAS, 427, 127 [NASA ADS] [CrossRef] [Google Scholar]
- Chen, Y., Girardi, L., Bressan, A., et al. 2014, MNRAS, 444, 2525 [Google Scholar]
- Chen, Z., Do, T., Ghez, A. M., et al. 2023, ApJ, 944, 79 [NASA ADS] [CrossRef] [Google Scholar]
- Choi, J., Dotter, A., Conroy, C., et al. 2016, ApJ, 823, 102 [Google Scholar]
- Dotter, A. 2016, ApJS, 222, 8 [Google Scholar]
- Eisenhauer, F., Quirrenbach, A., Zinnecker, H., & Genzel, R. 1998, ApJ, 498, 278 [NASA ADS] [CrossRef] [Google Scholar]
- Feldmeier-Krause, A., Zhu, L., Neumayer, N., et al. 2017, MNRAS, 466, 4040 [NASA ADS] [Google Scholar]
- Figer, D. F., Rich, R. M., Kim, S. S., Morris, M., & Serabyn, E. 2004, ApJ, 601, 319 [Google Scholar]
- Fritz, T. K., Gillessen, S., Dodds-Eden, K., et al. 2011, ApJ, 737, 73 [Google Scholar]
- Gadotti, D. A., Bittner, A., Falcón-Barroso, J., et al. 2020, A&A, 643, A14 [NASA ADS] [CrossRef] [EDP Sciences] [Google Scholar]
- Girardi, L. 2016, ARA&A, 54, 95 [Google Scholar]
- Harayama, Y., Eisenhauer, F., & Martins, F. 2008, ApJ, 675, 1319 [Google Scholar]
- Hatchfield, H. P., Sormani, M. C., Tress, R. G., et al. 2021, ApJ, 922, 79 [NASA ADS] [CrossRef] [Google Scholar]
- Helmi, A., Babusiaux, C., Koppelman, H. H., et al. 2018, Nature, 563, 85 [Google Scholar]
- Henshaw, J. D., Barnes, A. T., Battersby, C., et al. 2022, ArXiv e-prints [arXiv:2203.11223] [Google Scholar]
- Hidalgo, S. L., Pietrinferni, A., Cassisi, S., et al. 2018, ApJ, 856, 125 [Google Scholar]
- Hosek, M. W., Jr., Lu, J. R., Lam, C. Y., et al. 2020, AJ, 160, 143 [NASA ADS] [CrossRef] [Google Scholar]
- Hosek, M. W., Do, T., Lu, J. R., et al. 2022, ApJ, 939, 68 [NASA ADS] [CrossRef] [Google Scholar]
- Kruijssen, J. M. D., Pfeffer, J. L., Chevance, M., et al. 2020, MNRAS, 498, 2472 [NASA ADS] [CrossRef] [Google Scholar]
- Marigo, P., Girardi, L., Bressan, A., et al. 2017, ApJ, 835, 77 [Google Scholar]
- Nogueras-Lara, F. 2022, A&A, 666, A72 [NASA ADS] [CrossRef] [EDP Sciences] [Google Scholar]
- Nogueras-Lara, F., Schödel, R., Gallego-Calvente, A. T., et al. 2019, A&A, 631, A20 [NASA ADS] [CrossRef] [EDP Sciences] [Google Scholar]
- Nogueras-Lara, F., Schödel, R., Gallego-Calvente, A. T., et al. 2020, Nat. Astron., 4, 377 [Google Scholar]
- Nogueras-Lara, F., Schödel, R., & Neumayer, N. 2021a, A&A, 653, A33 [NASA ADS] [CrossRef] [EDP Sciences] [Google Scholar]
- Nogueras-Lara, F., Schödel, R., & Neumayer, N. 2021b, A&A, 653, A133 [NASA ADS] [CrossRef] [EDP Sciences] [Google Scholar]
- Nogueras-Lara, F., Schödel, R., & Neumayer, N. 2022, Nat. Astron., 6, 1178 [NASA ADS] [CrossRef] [Google Scholar]
- Nogueras-Lara, F., Schultheis, M., Najarro, F., et al. 2023, A&A, 671, L10 [NASA ADS] [CrossRef] [EDP Sciences] [Google Scholar]
- Pastorelli, G., Marigo, P., Girardi, L., et al. 2020, MNRAS, 498, 3283 [Google Scholar]
- Paxton, B., Bildsten, L., Dotter, A., et al. 2011, ApJS, 192, 3 [Google Scholar]
- Paxton, B., Schwab, J., Bauer, E. B., et al. 2018, ApJS, 234, 34 [NASA ADS] [CrossRef] [Google Scholar]
- Pfuhl, O., Fritz, T. K., Zilka, M., et al. 2011, ApJ, 741, 108 [Google Scholar]
- Pietrinferni, A., Hidalgo, S., Cassisi, S., et al. 2021, ApJ, 908, 102 [NASA ADS] [CrossRef] [Google Scholar]
- Rui, N. Z., Hosek, M. W., Jr., Lu, J. R., et al. 2019, ApJ, 877, 37 [NASA ADS] [CrossRef] [Google Scholar]
- Ruiz-Lara, T., Gallart, C., Bernard, E. J., & Cassisi, S. 2020, Nat. Astron., 4, 965 [NASA ADS] [CrossRef] [Google Scholar]
- Sanders, J. L., Matsunaga, N., Kawata, D., et al. 2022, MNRAS, 517, 257 [CrossRef] [Google Scholar]
- Schödel, R., Najarro, F., Muzic, K., & Eckart, A. 2010, A&A, 511, A18 [Google Scholar]
- Schödel, R., Feldmeier, A., Kunneriath, D., et al. 2014a, A&A, 566, A47 [Google Scholar]
- Schödel, R., Feldmeier, A., Neumayer, N., Meyer, L., & Yelda, S. 2014b, Class. Quant. Grav., 31, 244007 [CrossRef] [Google Scholar]
- Schödel, R., Nogueras-Lara, F., Gallego-Cano, E., et al. 2020, A&A, 641, A102 [Google Scholar]
- Schultheis, M., Fritz, T. K., Nandakumar, G., et al. 2021, A&A, 650, A191 [NASA ADS] [CrossRef] [EDP Sciences] [Google Scholar]
- Shahzamanian, B., Schödel, R., Nogueras-Lara, F., et al. 2022, A&A, 662, A11 [NASA ADS] [CrossRef] [EDP Sciences] [Google Scholar]
- Sormani, M. C., Sanders, J. L., Fritz, T. K., et al. 2022, MNRAS, 512, 1857 [CrossRef] [Google Scholar]
- Tang, J., Bressan, A., Rosenfield, P., et al. 2014, MNRAS, 445, 4287 [NASA ADS] [CrossRef] [Google Scholar]
All Figures
|
Fig. 1. Colour–magnitude diagrams for the Quintuplet field. Foreground stars (F127M − F153M < 1.8 mag) are shown in blue, Galactic Centre stars in brown, and probable Quintuplet cluster members (membership probability from proper motions > 50%) as green crosses. Some foreground and background stars move along with the bulk of the Quintuplet and are therefore also shown as green crosses (see Rui et al. 2019). The probable members of the Quintuplet cluster are only shown in the left panel. |
| In the text | |
|
Fig. 2. Vector point diagram for the catalogue for the Quintuplet field. The quality cuts of Hosek et al. (2022) have been applied to include only high-quality proper motions in this figure. Shown are the number of sources per proper motion bin, considering the velocities parallel and perpendicular to the Galactic Plane, μb and μlcos(b), respectively. The arrow points to the position of the Quintuplet cluster in proper motion space. The orange ellipse indicates our selection criterion for nuclear stellar disc members. |
| In the text | |
|
Fig. 3. Colour–magnitude diagram. Blue: foreground stars; red: background stars; orange: RC stars used for dereddening; pink: young stars from the Quintuplet cluster. |
| In the text | |
|
Fig. 4. Observed (black) and dereddened (green) CMDs and luminosity functions. Excluded outliers are shown in red in the CMD. At faint magnitudes the green ‘cloud’ becomes narrower because of the systematics of the outlier estimation (red sources drop out). This does not have any influence on our analysis, because these faint stars lie several magnitudes below our completeness cut-off. The orange luminosity function excludes the outliers after dereddening. |
| In the text | |
|
Fig. 5. Fit of cumulative theoretical luminosity functions to the measured cumulative luminosity function of the NSD (data: black; data after completeness correction and including error bars: green; best fit: blue). Theoretical functions of all stellar population that contribute more than 1% of originally formed stellar mass are colour-coded (see inset). |
| In the text | |
|
Fig. 6. Comparison between theoretical luminosity functions in the region around the asymptotic giant branch bump (AGBB), RC bump (RCB) and the red giant branch bump (RGBB) for the MIST, PARSEC, and Basti (current and 2014 release) evolutionary codes. The AGB, RC, and RGB bumps are key features used to constrain the star formation history from luminosity functions. The stellar magnitudes assume no extinction, but a distance modulus of 14.51 mag. |
| In the text | |
|
Fig. 7. Observed frequencies of different age bins in the MC simulation of the star formation history. The different panels correspond to different stellar evolution models, as labelled. |
| In the text | |
|
Fig. 8. Star formation history of the NSD based on the mean and standard deviations of the best fits to the cumulative F153M luminosity function, testing different sources of systematic uncertainties (see text). Left: resulting star formation history for different evolutionary models (blue: PARSEC; black: MIST; orange: Basti). Right: mean star formation history across all models and systematic assumptions. |
| In the text | |
Current usage metrics show cumulative count of Article Views (full-text article views including HTML views, PDF and ePub downloads, according to the available data) and Abstracts Views on Vision4Press platform.
Data correspond to usage on the plateform after 2015. The current usage metrics is available 48-96 hours after online publication and is updated daily on week days.
Initial download of the metrics may take a while.