Fig. 8.
Download original image
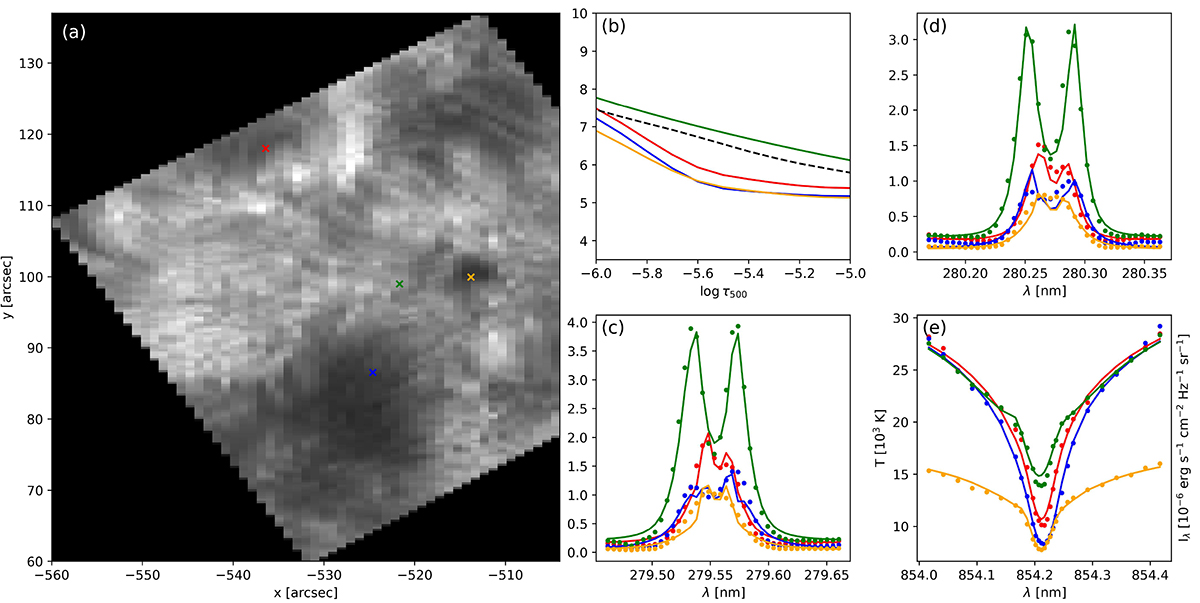
Examples of the inversion results for different pixels in the field of view of set B. (a) Intensity at the core of the Ca II line. The colours of the marked pixels correspond to the examples displayed on the other panels. (b) Temperature stratification inversion results at the range log τ500 = [ − 5, −6] for the different marked pixels on panel (a). Black line corresponds to the temperature stratification of the original input model. (c) Synthesised profiles as a result of the inversions (continuous lines) compared to the observed spectral profiles (dots) for the Mg II k line. (d) Same as panel (c) for the Mg II h line. (e) Same as (c) and (d) for the Ca II line.
Current usage metrics show cumulative count of Article Views (full-text article views including HTML views, PDF and ePub downloads, according to the available data) and Abstracts Views on Vision4Press platform.
Data correspond to usage on the plateform after 2015. The current usage metrics is available 48-96 hours after online publication and is updated daily on week days.
Initial download of the metrics may take a while.