Fig. 5.
Download original image
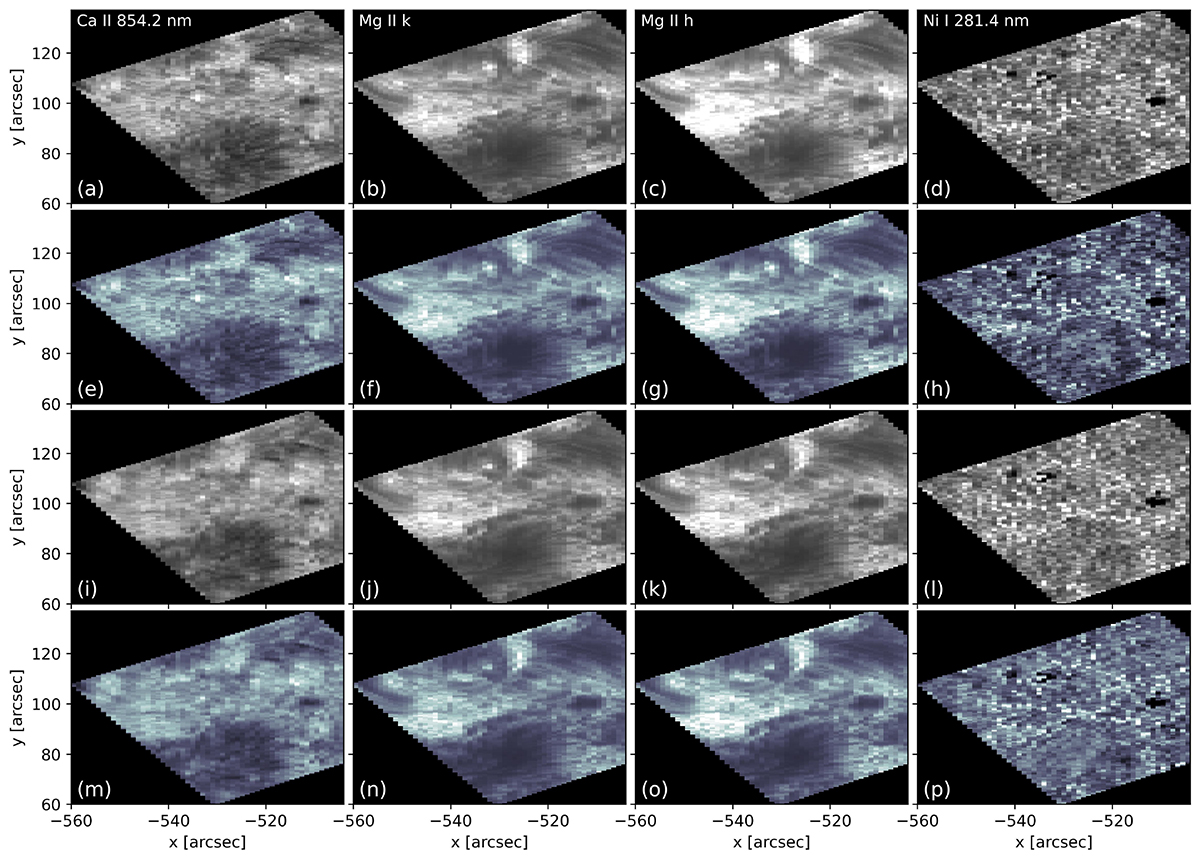
Comparison between the observed and inverted intensity maps. The grayscale maps represent the observations, while the blue intensity maps represent the inversion results. Panels (a)–(d): Set A observations at different wavelength positions, the first at the core of the Ca II line, the second and third columns at the cores of the Mg II h & k lines, and the fourth at the Ni I 281.4 nm line core. Panels (e)–(f): intensity maps from the inversions of set A at the same wavelength positions. Panels (i)–(l): same as panels (a)−(d) for set B. Panels (m)–(p): same as panels (e)−(h) for set B. For comparison purposes, the intensity range for each pair of observed/inverted intensity maps is the same.
Current usage metrics show cumulative count of Article Views (full-text article views including HTML views, PDF and ePub downloads, according to the available data) and Abstracts Views on Vision4Press platform.
Data correspond to usage on the plateform after 2015. The current usage metrics is available 48-96 hours after online publication and is updated daily on week days.
Initial download of the metrics may take a while.