Open Access
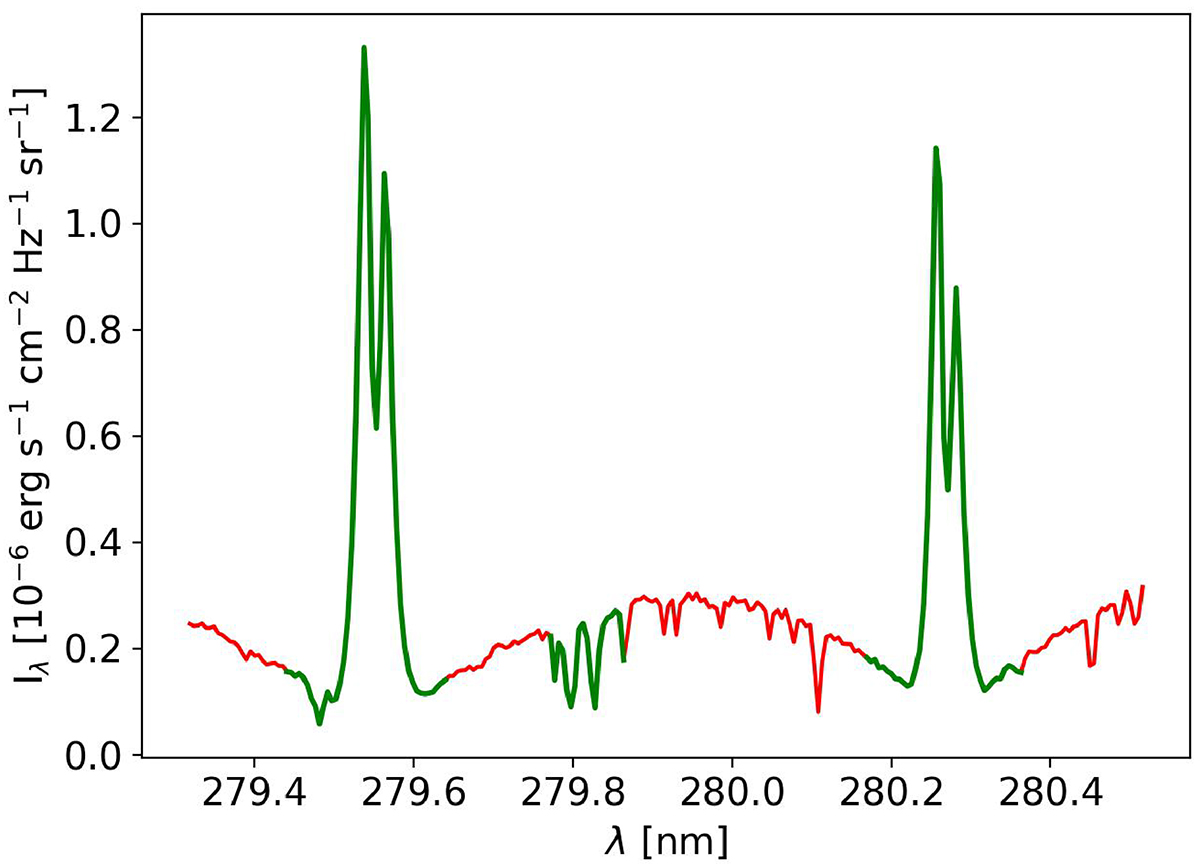
Fig. 4.
Download original image
Typical Mg II spectral line used for the inversions. The green line represents the spectral region that was used for the inversions. The spectral regions shown with red colour have been omitted to save computational time. This spectral profile corresponds to a dark fibril pixel (green star in Fig. 3).
Current usage metrics show cumulative count of Article Views (full-text article views including HTML views, PDF and ePub downloads, according to the available data) and Abstracts Views on Vision4Press platform.
Data correspond to usage on the plateform after 2015. The current usage metrics is available 48-96 hours after online publication and is updated daily on week days.
Initial download of the metrics may take a while.