Fig. 3.
Download original image
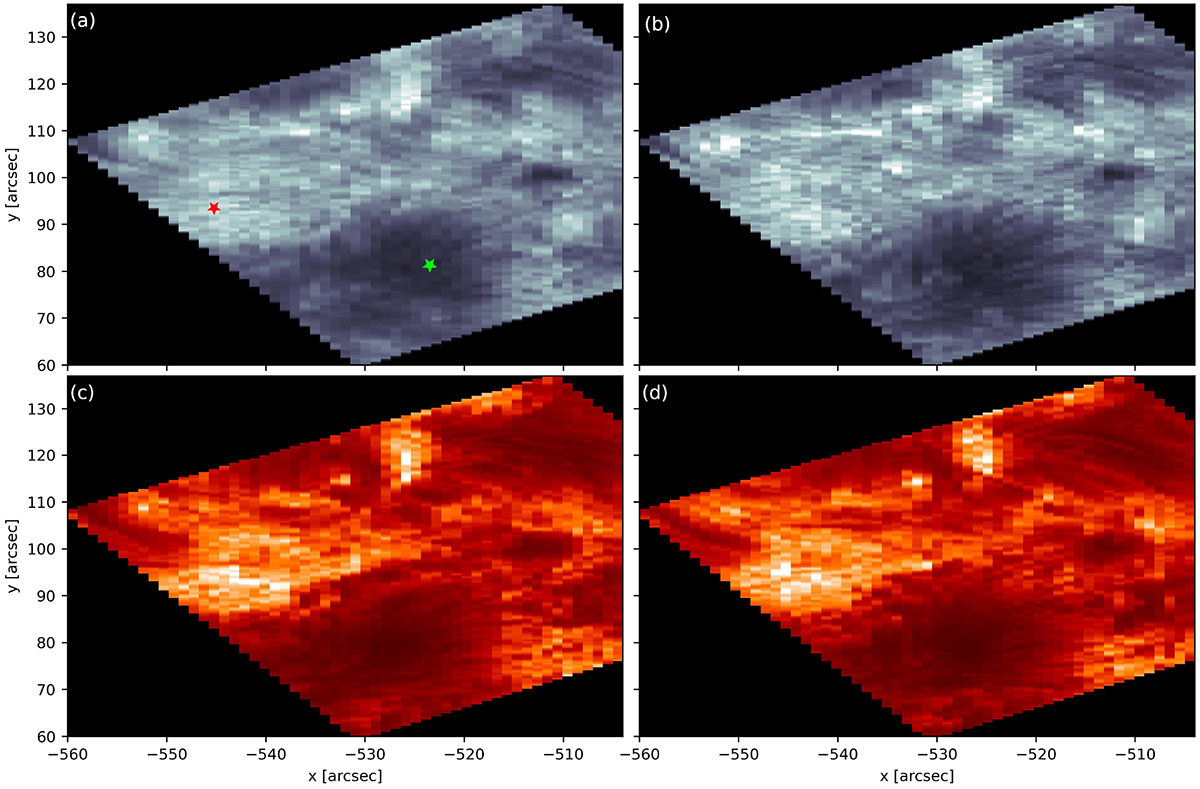
Aligned Ca II and Mg II observations. Ca II line core images for (a) sets A and (b) B, and Mg II k line core images also for (c) sets A and (d) B. The brightness of each image has been scaled independently. The red star in panel (a) marks the location of the representative pixel used in Fig. 6, while the green star marks the location of the pixel used in Fig. 4.
Current usage metrics show cumulative count of Article Views (full-text article views including HTML views, PDF and ePub downloads, according to the available data) and Abstracts Views on Vision4Press platform.
Data correspond to usage on the plateform after 2015. The current usage metrics is available 48-96 hours after online publication and is updated daily on week days.
Initial download of the metrics may take a while.