Open Access
Fig. 2.
Download original image
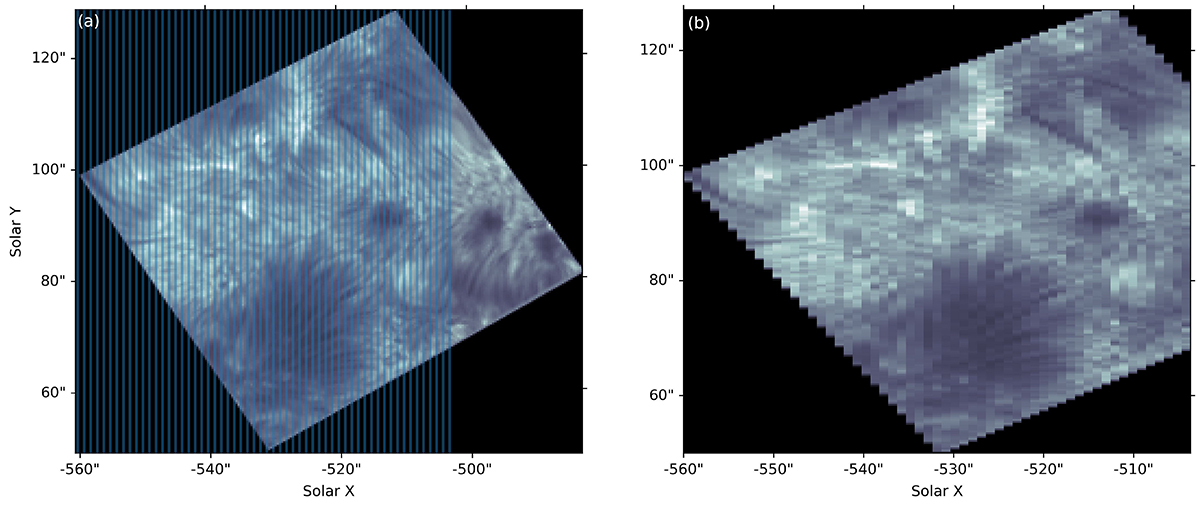
Spatio-temporal alignment example. (a) Spatially averaged and rotated Ca II line core image with the vertical blue lines representing the position of the IRIS slit over time and (b) Ca II line core re-sampled to the IRIS slit positions.
Current usage metrics show cumulative count of Article Views (full-text article views including HTML views, PDF and ePub downloads, according to the available data) and Abstracts Views on Vision4Press platform.
Data correspond to usage on the plateform after 2015. The current usage metrics is available 48-96 hours after online publication and is updated daily on week days.
Initial download of the metrics may take a while.