Open Access
Fig. 12.
Download original image
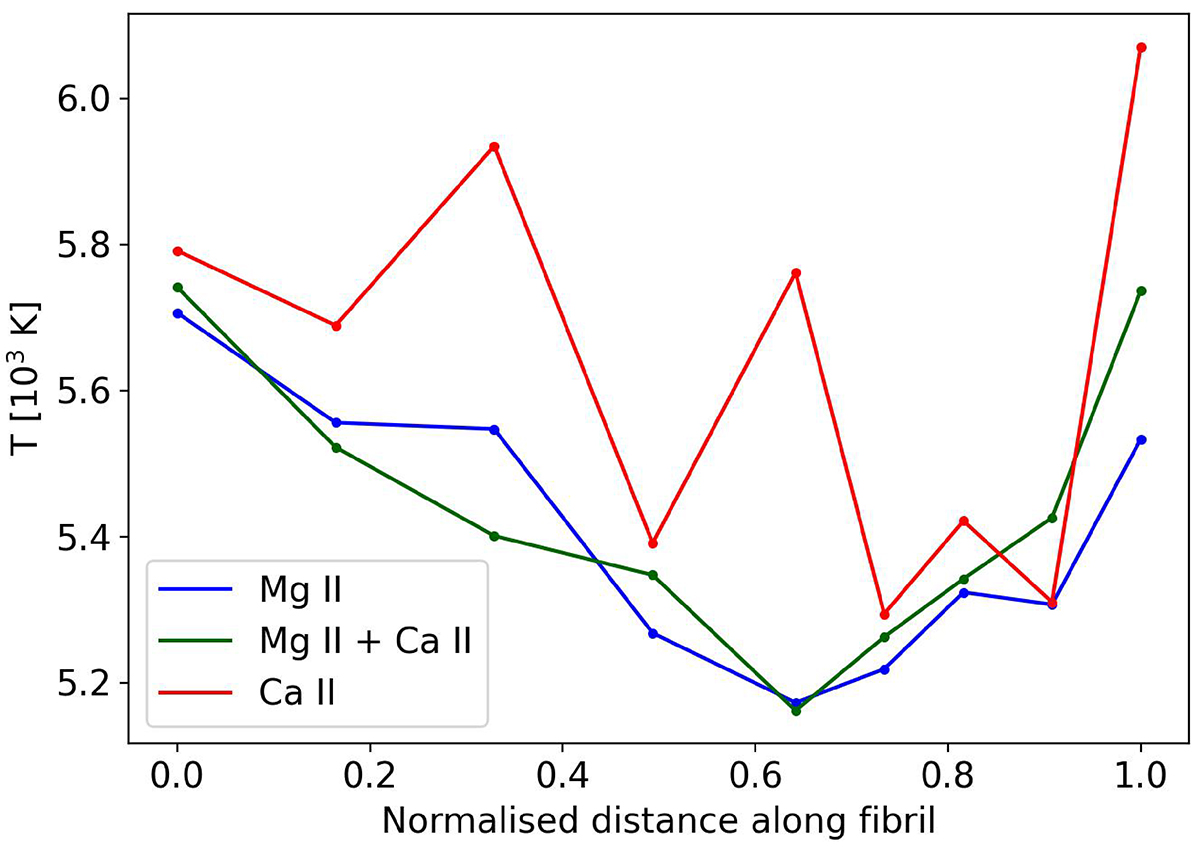
Multiline inversions. Comparison of the temperature variation along the traced fibril centred around (X, Y) = (−538″, 120″) from set A (see top-left panel of Fig. 10) as inverted using the Ca II data (red), the Mg II data (blue), and the combined spectra from both elements (green).
Current usage metrics show cumulative count of Article Views (full-text article views including HTML views, PDF and ePub downloads, according to the available data) and Abstracts Views on Vision4Press platform.
Data correspond to usage on the plateform after 2015. The current usage metrics is available 48-96 hours after online publication and is updated daily on week days.
Initial download of the metrics may take a while.