Fig. 8.
Download original image
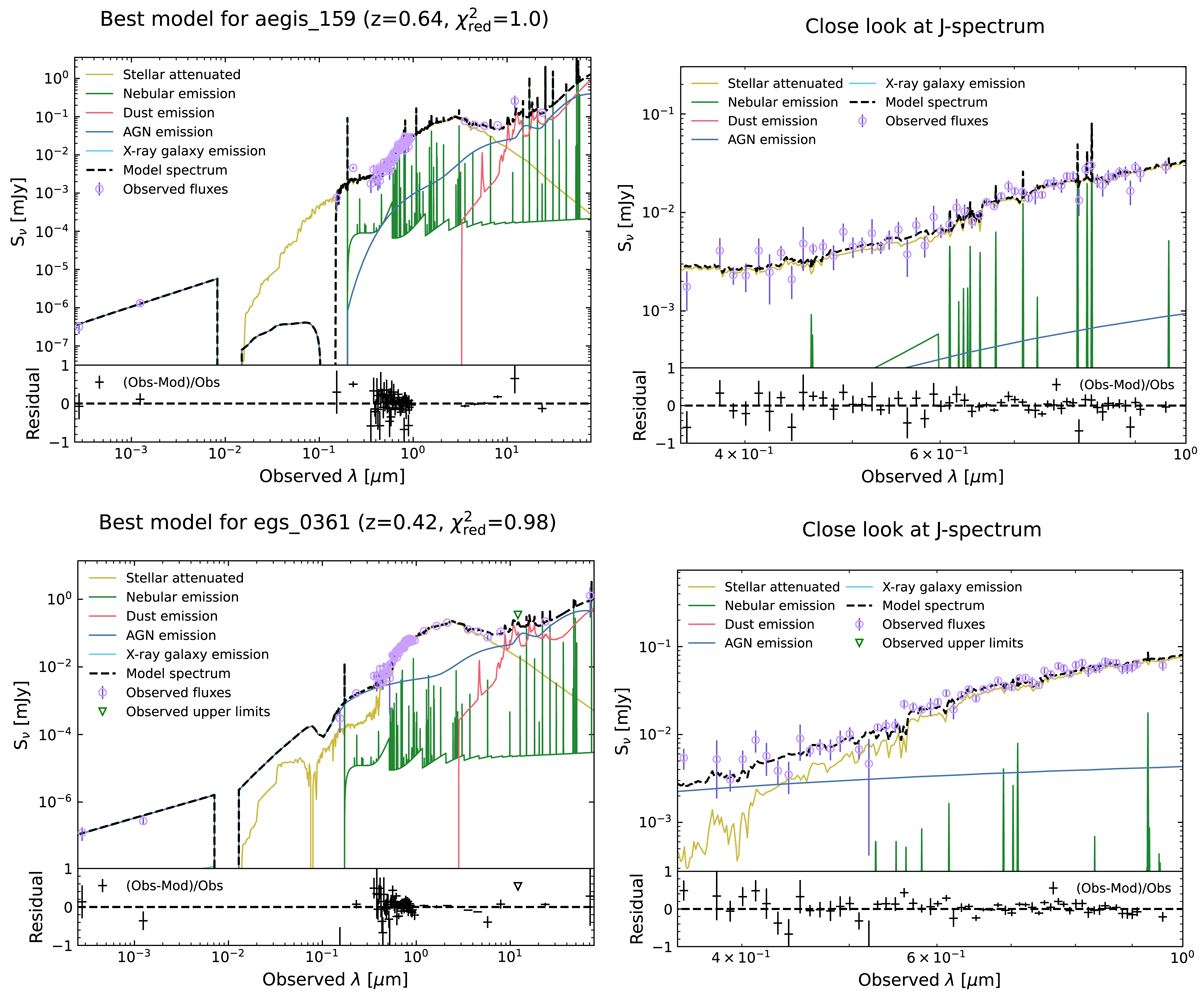
Examples of SED fitting using CIGALE and their residuals. Pink circles show the photometry for each band used. Green triangles are upper limits. The black dashed line is the composite model, and the color lines are the individual components of the composite model. Left: full range of wavelengths, from X-ray to IR. Right: close up on optical miniJPAS J-spectrum.
Current usage metrics show cumulative count of Article Views (full-text article views including HTML views, PDF and ePub downloads, according to the available data) and Abstracts Views on Vision4Press platform.
Data correspond to usage on the plateform after 2015. The current usage metrics is available 48-96 hours after online publication and is updated daily on week days.
Initial download of the metrics may take a while.