Fig. 3
Download original image
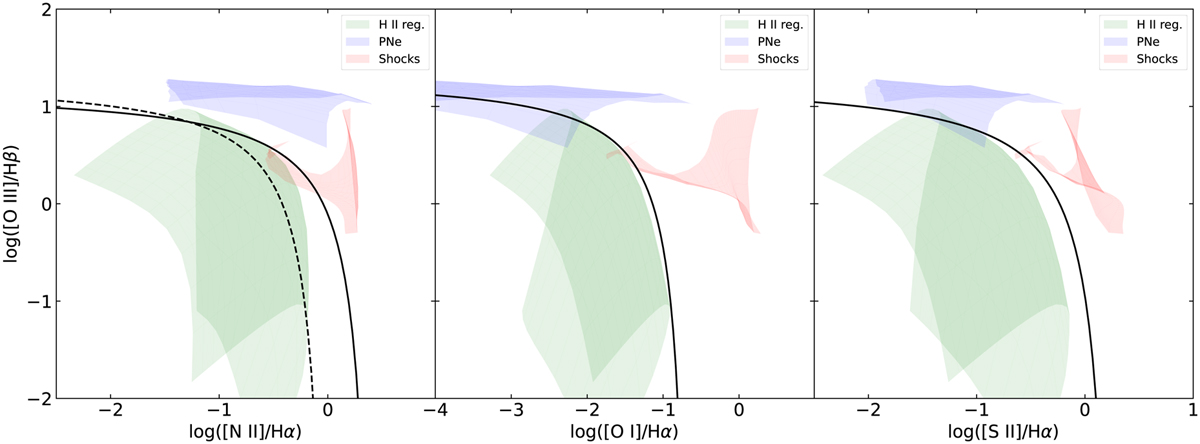
Line ratios from the models used for classifying the nebulae in the catalogue plotted in the traditional diagnostic diagrams from Baldwin et al. (1981). Black solid lines represent the relations from Kewley et al. (2001) which separates star-forming regions from other kinds of sources. The black dashed line represents the limit for pure star formation identified by Kauffmann et al. (2003).
Current usage metrics show cumulative count of Article Views (full-text article views including HTML views, PDF and ePub downloads, according to the available data) and Abstracts Views on Vision4Press platform.
Data correspond to usage on the plateform after 2015. The current usage metrics is available 48-96 hours after online publication and is updated daily on week days.
Initial download of the metrics may take a while.