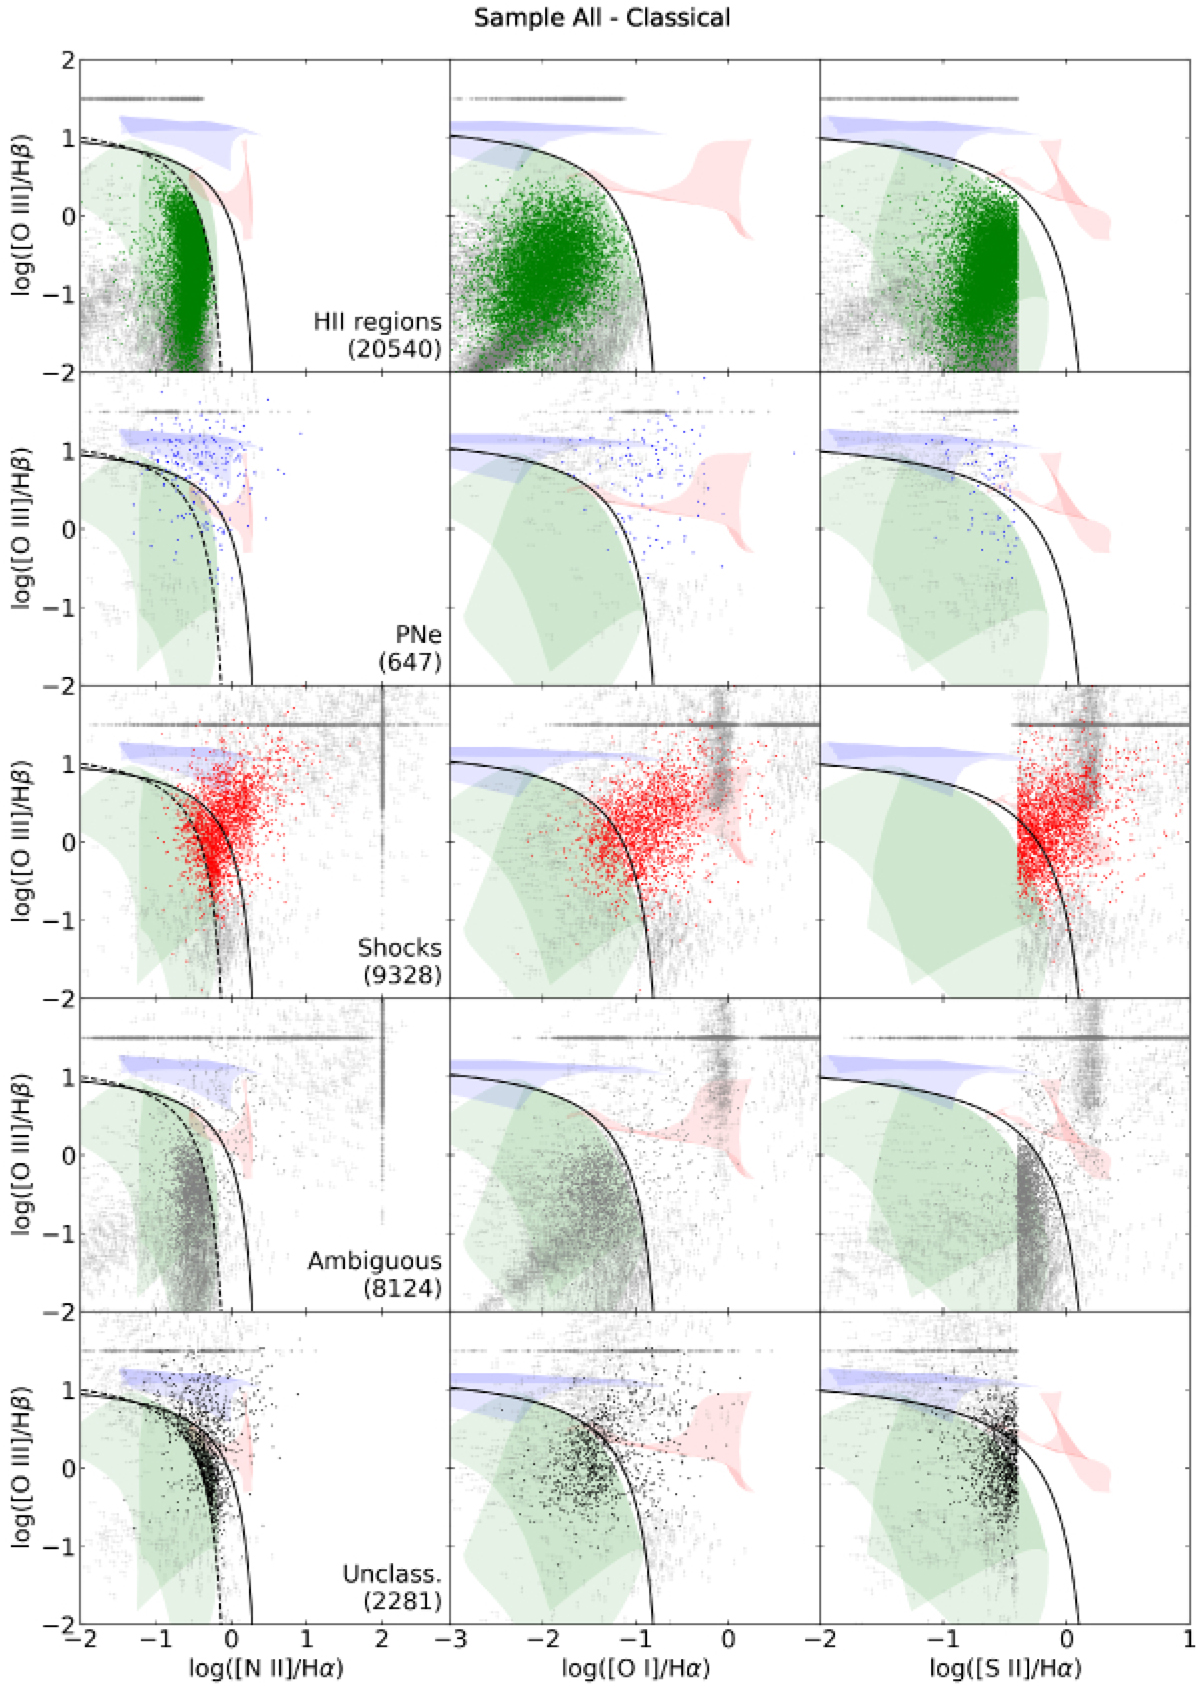
Fig. A.1
Download original image
Diagnostic diagrams from Baldwin et al. (1981) and Veilleux & Osterbrock (1987) for the full sample. Lines and shaded areas are defined as in Fig. 3. Here, the regions are classified according to the traditional classification criteria. In each row only, from top to bottom, we show: H II regions (green), PNe (blue), shocks (red), ambiguous (grey) and unclassified (black) objects.
Current usage metrics show cumulative count of Article Views (full-text article views including HTML views, PDF and ePub downloads, according to the available data) and Abstracts Views on Vision4Press platform.
Data correspond to usage on the plateform after 2015. The current usage metrics is available 48-96 hours after online publication and is updated daily on week days.
Initial download of the metrics may take a while.