Fig. 21
Download original image
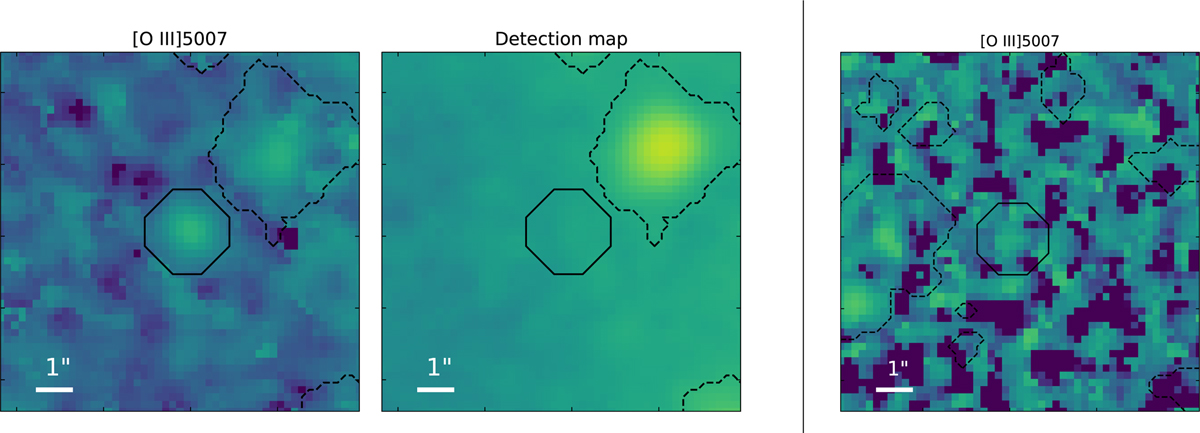
Examples of nebulae in Scheuermann et al. (2022) not included in our catalogue. Left: detail of NGC 1365 (region 10 in Scheuermann et al. 2022) in the [O III]λ5007 emission line map (left) and our detection map (right). In both plots, the solid black contours show the position of one of the nebulae detected in Scheuermann et al. (2022) catalogue, while the dashed contours show the position of the nebulae in our catalogue. This figure shows how the nebula, clearly detected in the single line map, is not detectable in our detection map since it is blended with the relatively high background. 1″ in NGC 1365 corresponds to ~100 pc. Right: detail of the [O III]λ5007 emission line map of IC 5332 (region 56 in Scheuermann et al. 2022). The solid black contours show the position of one of the nebulae detected in Scheuermann et al. (2022) catalogue, while the dashed contours show the position of the nebulae in our catalogue. 1″ in IC 5332 corresponds to ~45 pc.
Current usage metrics show cumulative count of Article Views (full-text article views including HTML views, PDF and ePub downloads, according to the available data) and Abstracts Views on Vision4Press platform.
Data correspond to usage on the plateform after 2015. The current usage metrics is available 48-96 hours after online publication and is updated daily on week days.
Initial download of the metrics may take a while.