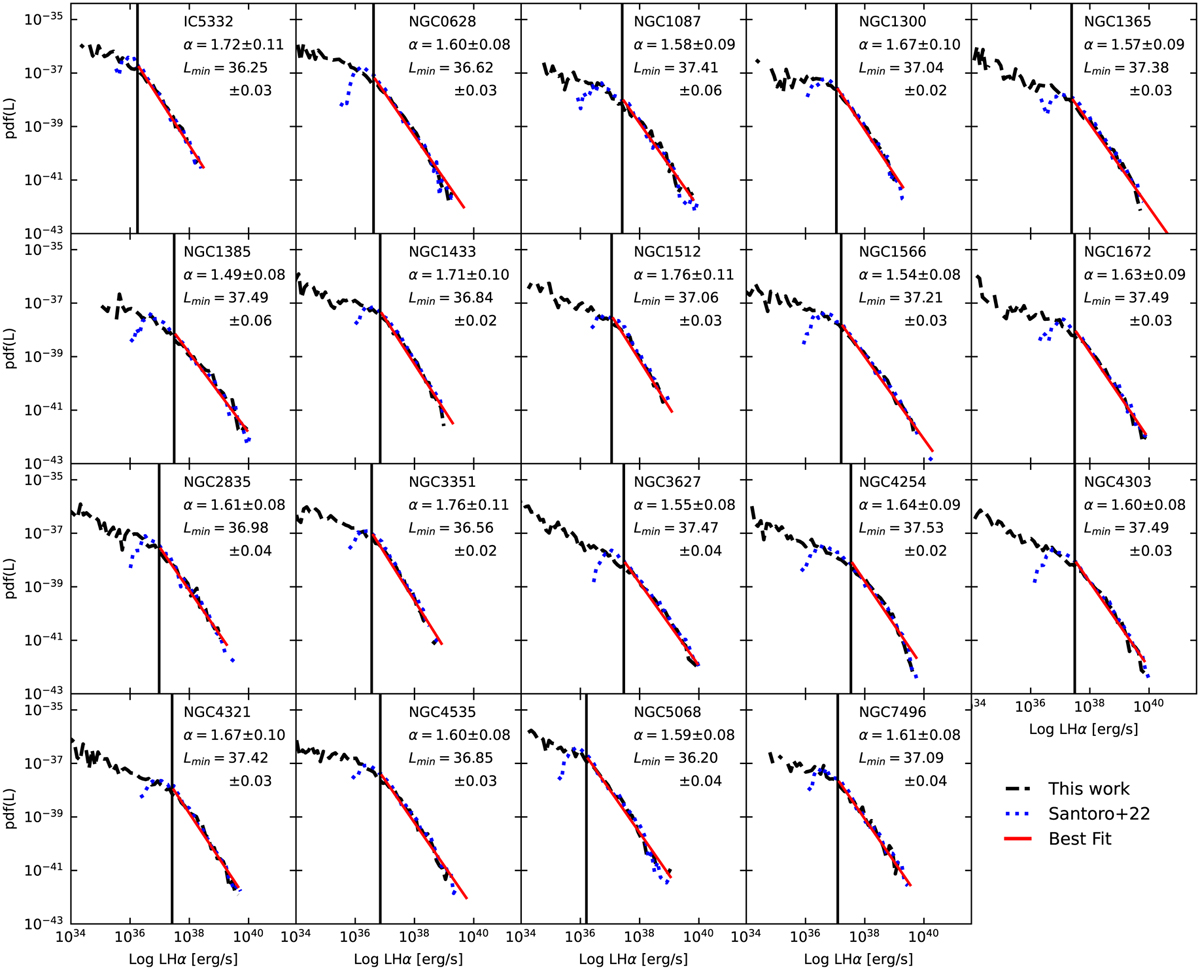
Fig. 20
Download original image
H II regions LF for each galaxy in the PHANGS-MUSE sample. Only objects satisfying the selection described in Sect. 7.4 have been used to compute the LF. The black dashed lines represent the observed LF, the blue dotted lines represent the LF from S22, the red line is the fit obtained from our data, and finally, the black vertical line is the low luminosity cut (Lmin). Only regions with L>Lmin are considered when fitting the LF.
Current usage metrics show cumulative count of Article Views (full-text article views including HTML views, PDF and ePub downloads, according to the available data) and Abstracts Views on Vision4Press platform.
Data correspond to usage on the plateform after 2015. The current usage metrics is available 48-96 hours after online publication and is updated daily on week days.
Initial download of the metrics may take a while.