Fig. 2
Download original image
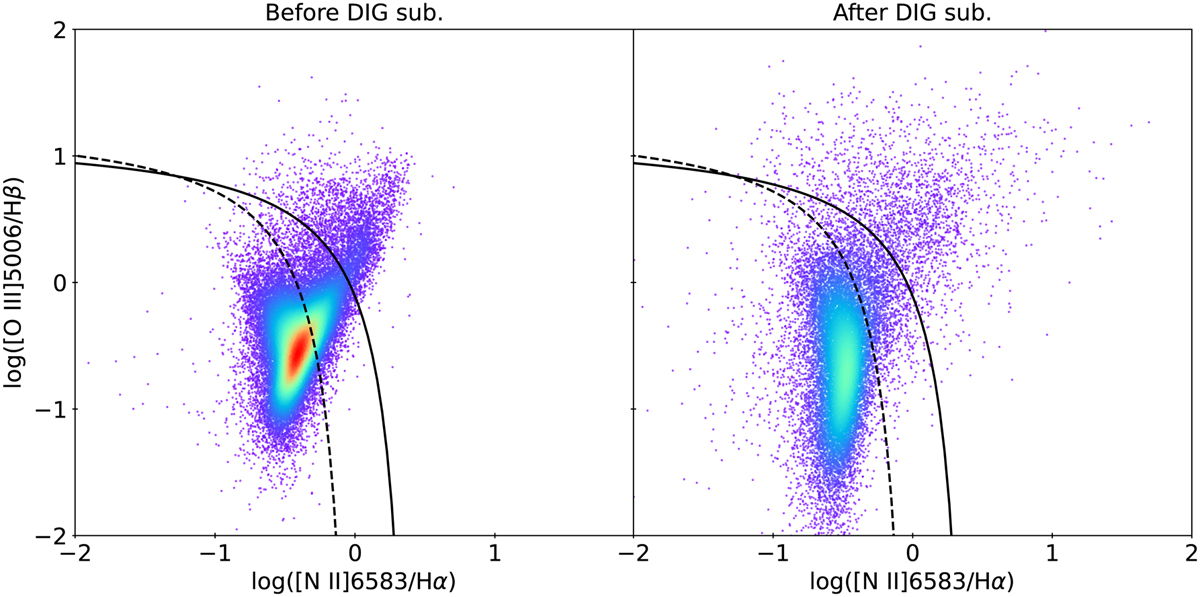
log([N II]/Hα) vs. k>g([O III]/Hβ) diagram of the nebulae before (left) and after (right) the correction for DIG contamination. Only nebulae where Hα, Hβ, [O III]λ5007 and [N II]λ6584 are detected at 3σ after the DIG correction are plotted in the right panel. The colour map qualitatively shows how the points are concentrated. The solid and dashed black lines are the relation from Kewley et al. (2001) and Kauffmann et al. (2003) which separate star-forming regions from regions ionised by other ionising sources.
Current usage metrics show cumulative count of Article Views (full-text article views including HTML views, PDF and ePub downloads, according to the available data) and Abstracts Views on Vision4Press platform.
Data correspond to usage on the plateform after 2015. The current usage metrics is available 48-96 hours after online publication and is updated daily on week days.
Initial download of the metrics may take a while.