Fig. 19
Download original image
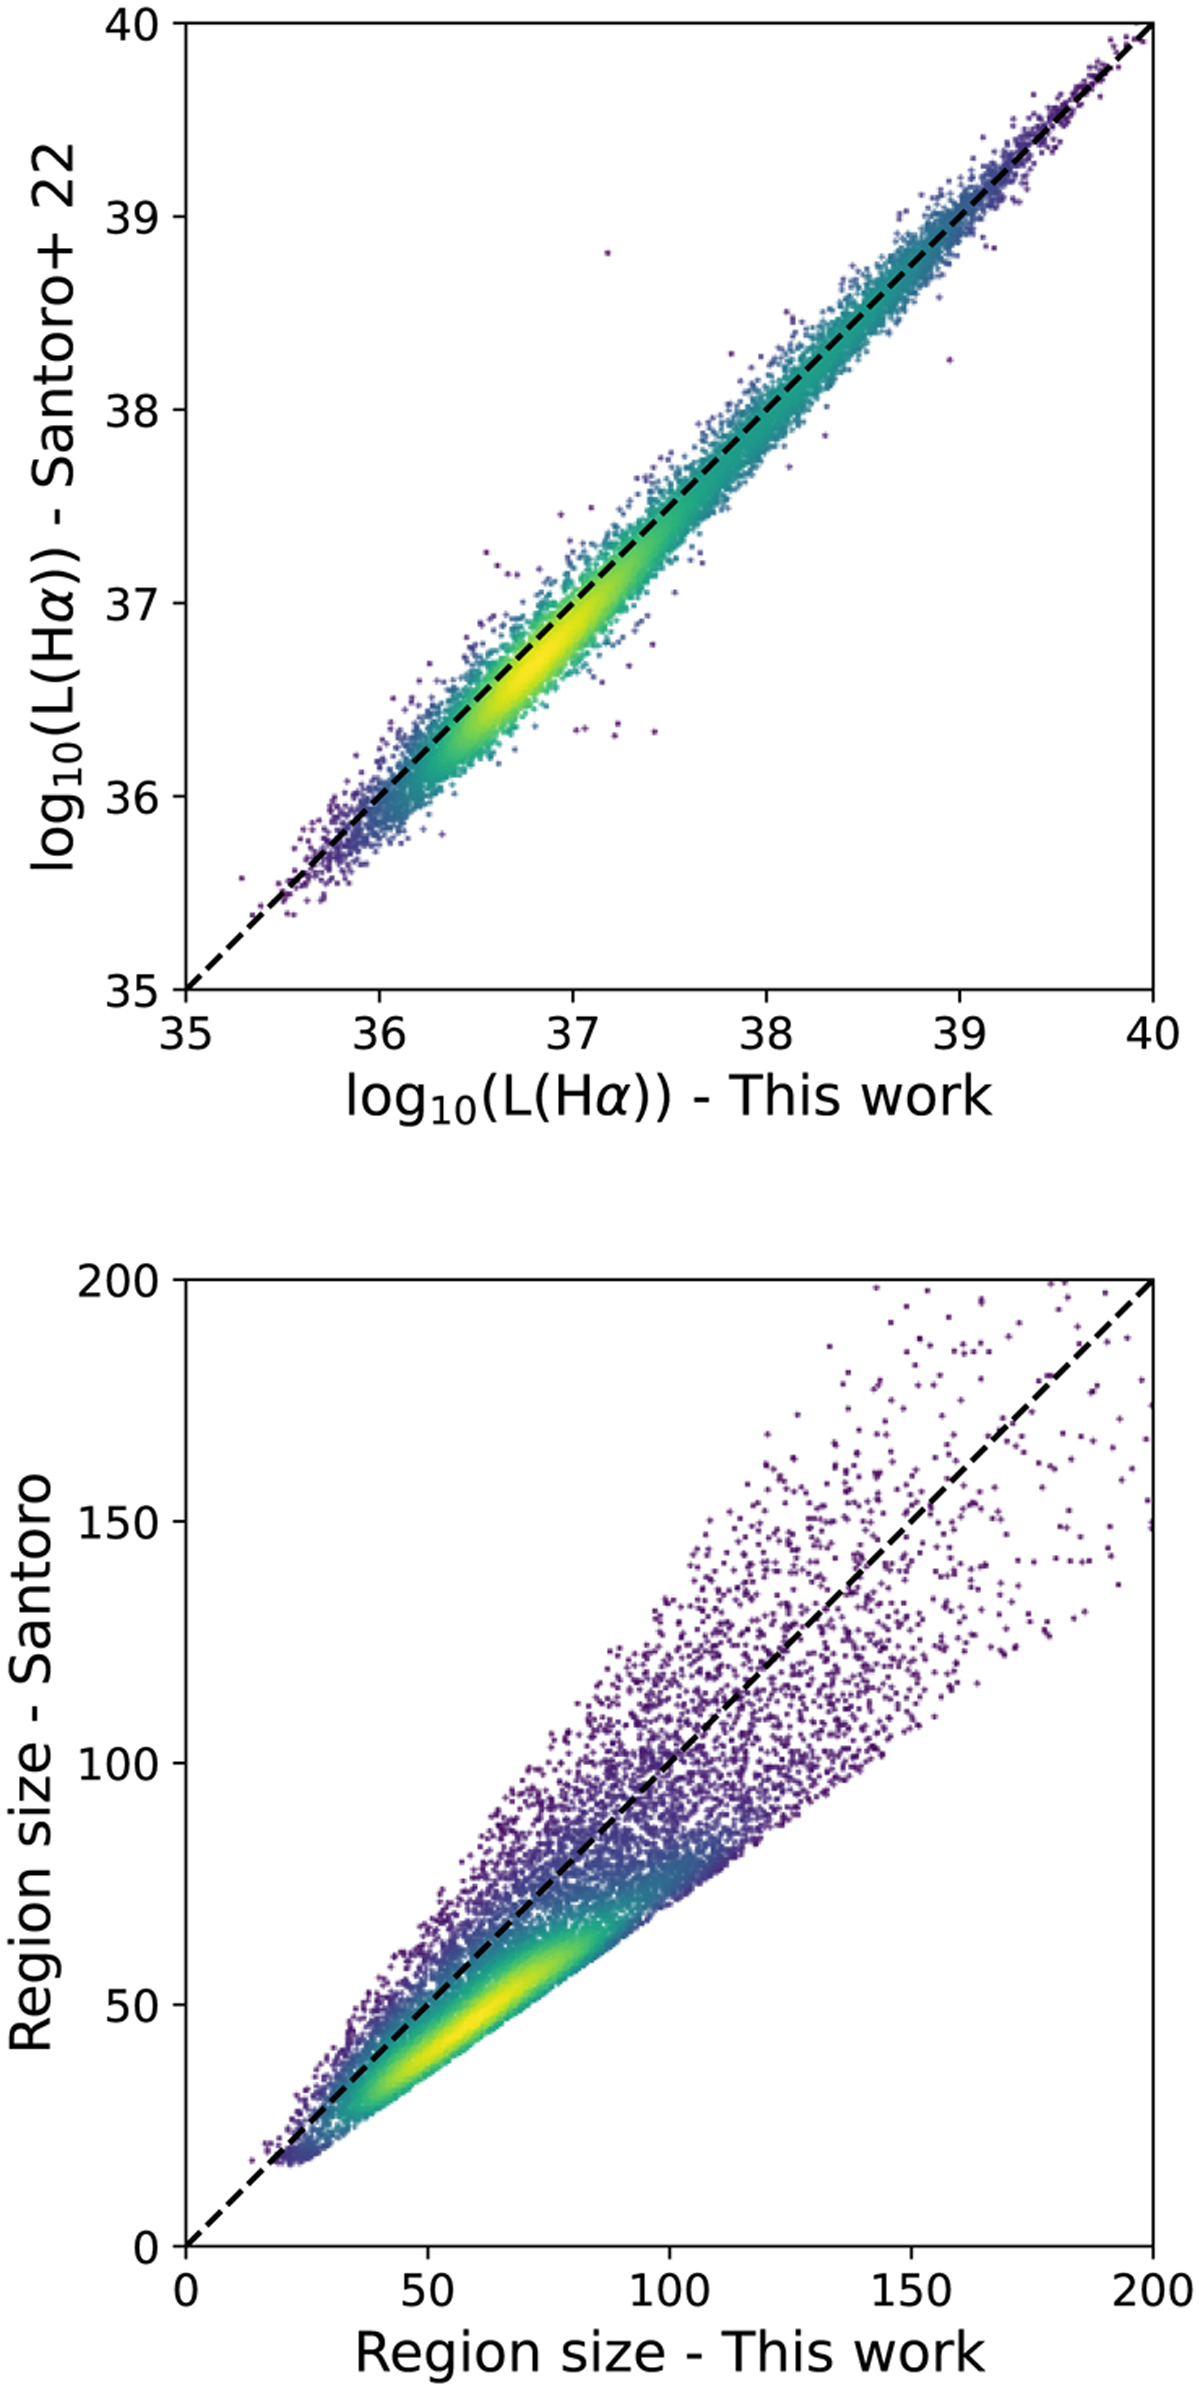
Scatter plots showing a direct comparison between the properties of the regions that are present in both catalogues. The top plot shows a comparison between the Hα luminosity, while the bottom one compares the circularised radii of the nebulae. The dashed lines in both plots represent a one-to-one relation. Colours visually represent the density of points in a specific plot area.
Current usage metrics show cumulative count of Article Views (full-text article views including HTML views, PDF and ePub downloads, according to the available data) and Abstracts Views on Vision4Press platform.
Data correspond to usage on the plateform after 2015. The current usage metrics is available 48-96 hours after online publication and is updated daily on week days.
Initial download of the metrics may take a while.