Fig. 18
Download original image
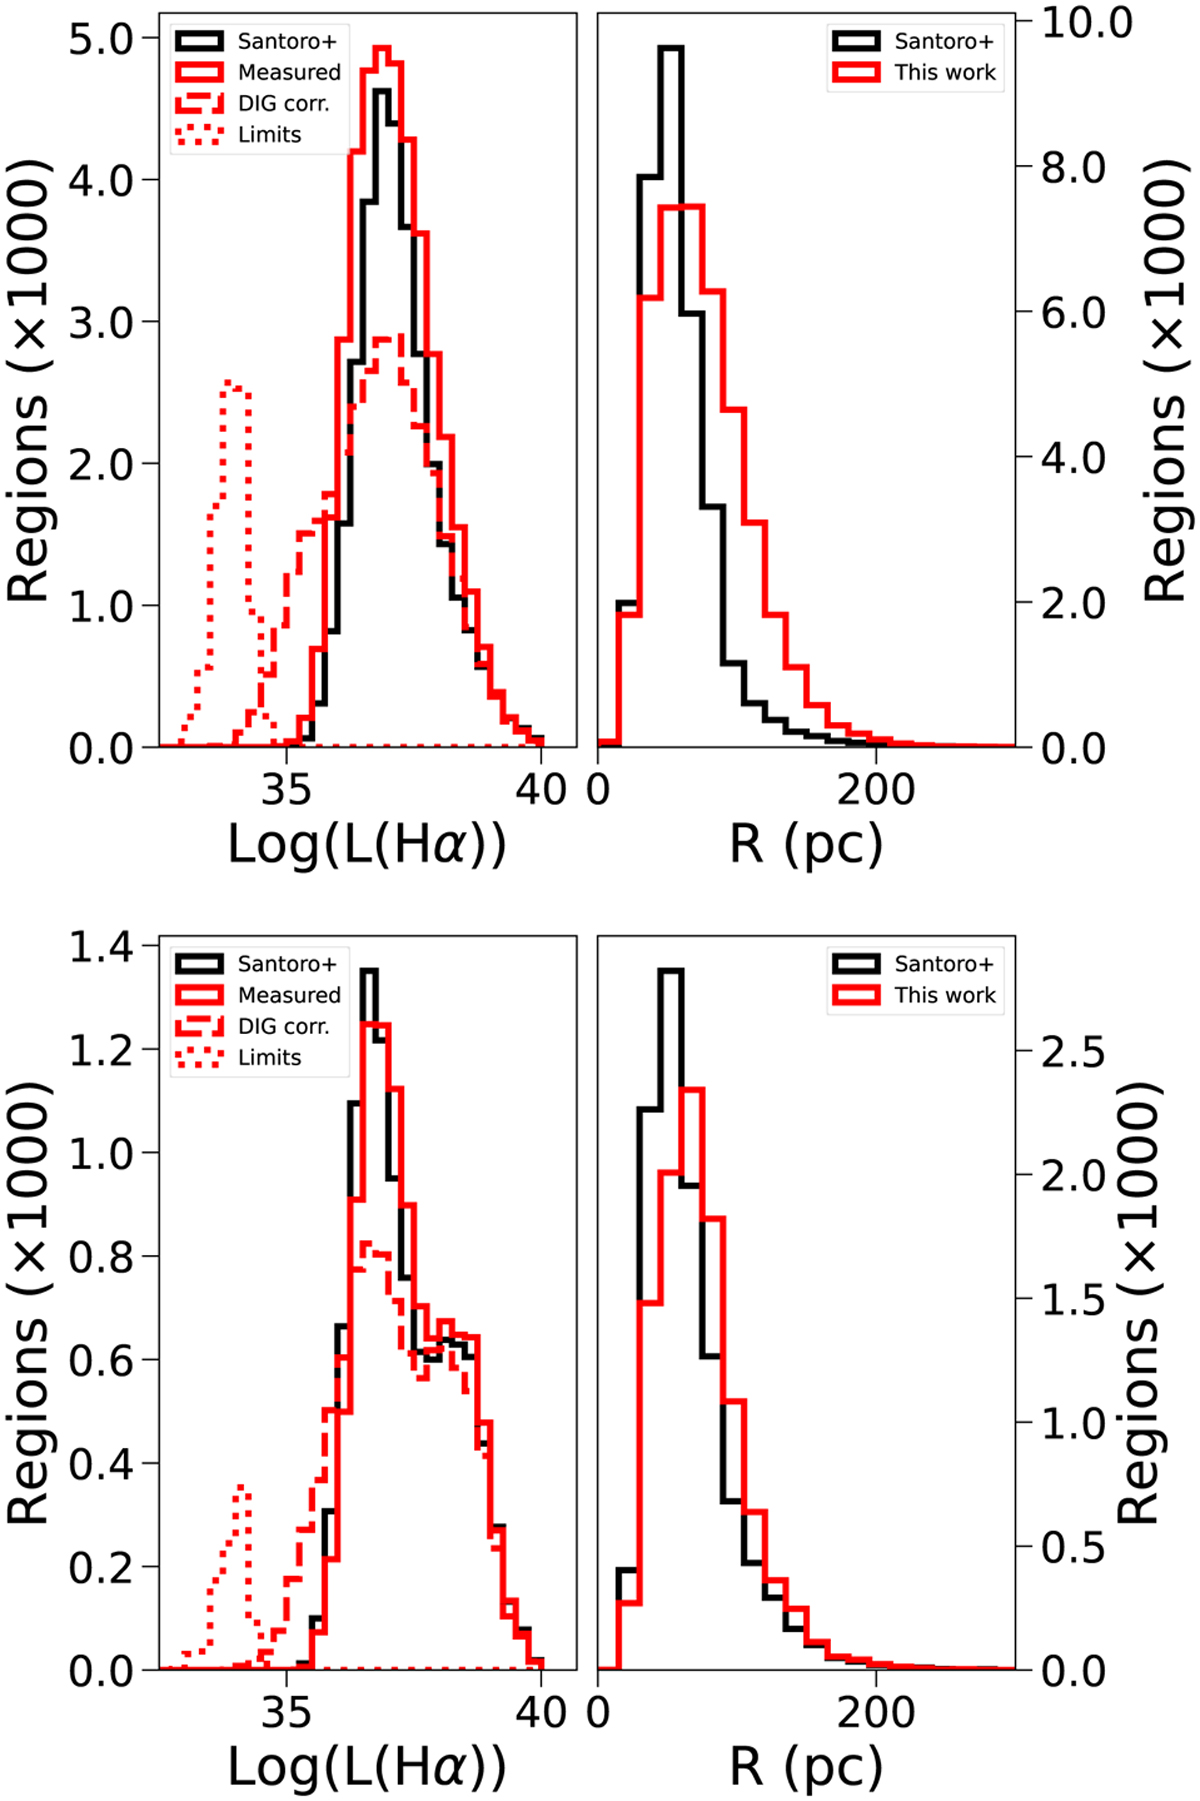
Comparison with S22 catalogue. Top: histograms comparing the main properties of our catalogue to the ones of the nebulae catalogue published in S22. The left panel shows the Hα luminosity distribution of the regions in the S22 catalogue (black), and that of our regions before the correction for DIG contribution (red). The dashed histogram reports the Hα luminosity distribution of our sample after the DIG correction, and the dotted one shows the upper limits for those regions where Hα is not detected after the DIG subtraction. On the right panel, we show the region size distribution in black for S22 and in red for this work. For both catalogues, the reported size is the circularised radius of the regions. Bottom: similar histograms comparing the properties of the matched regions. Symbols and colours are the same as in the top panel.
Current usage metrics show cumulative count of Article Views (full-text article views including HTML views, PDF and ePub downloads, according to the available data) and Abstracts Views on Vision4Press platform.
Data correspond to usage on the plateform after 2015. The current usage metrics is available 48-96 hours after online publication and is updated daily on week days.
Initial download of the metrics may take a while.