Fig. 16
Download original image
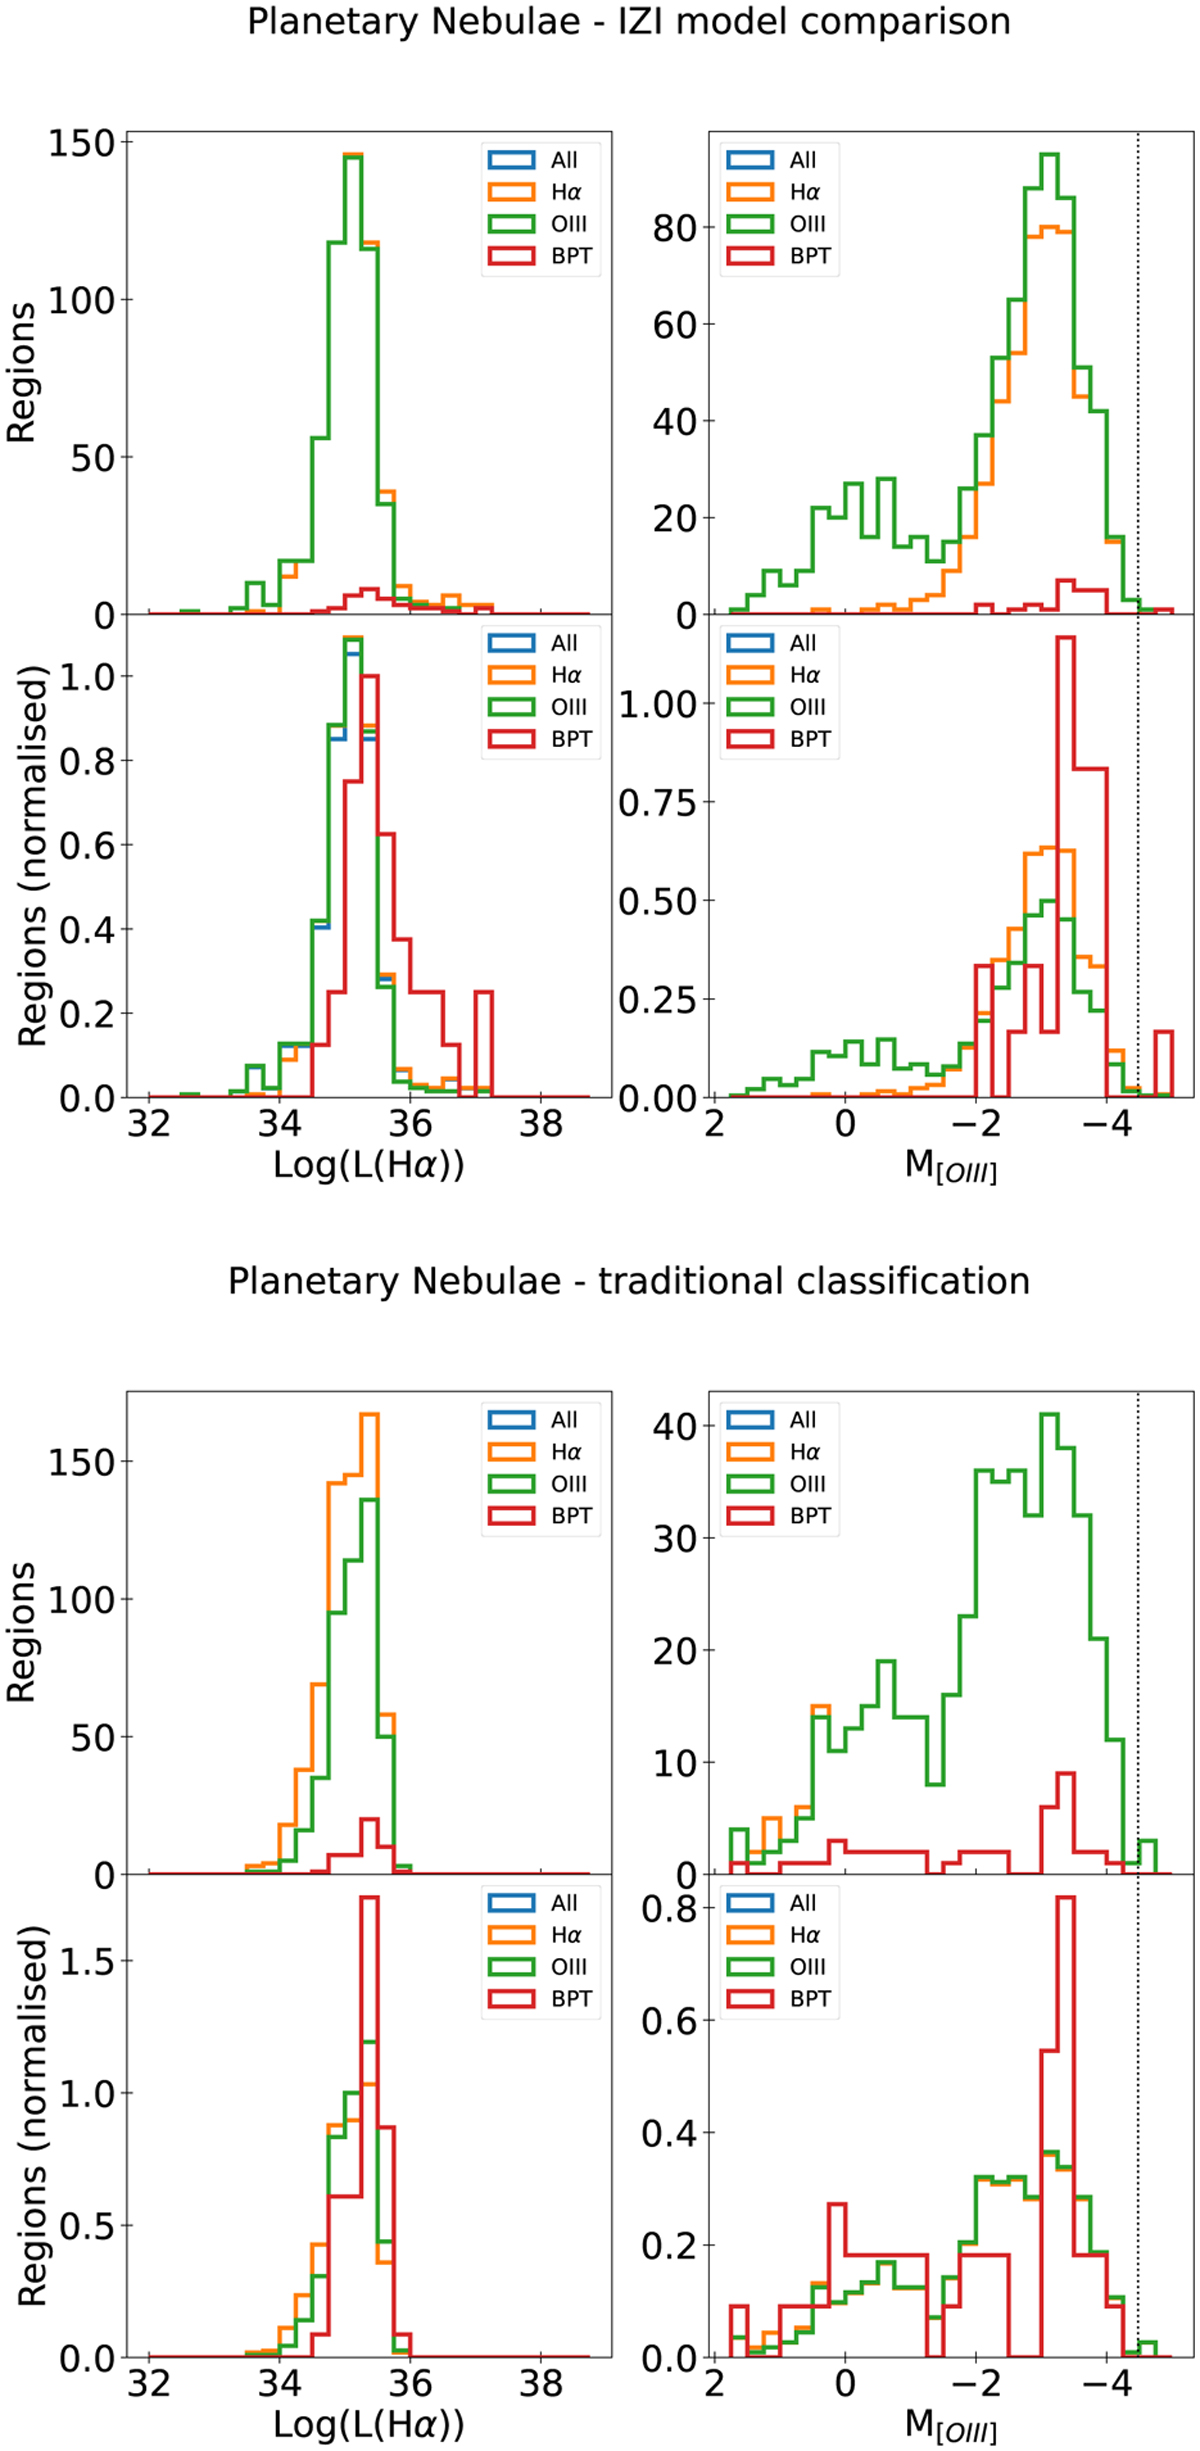
Physical properties of PNe. Top panel: histogram showing how the distribution of the main measured properties of PNe changes as a function of the considered sample. From the left to the right, the following quantities are shown: Hα luminosity, [O III]λ5007 absolute magnitude (adapted from Eq. (4) using distances from Table 1). The top row shows the absolute distribution for each quantity, while the bottom row shows the normalised distribution. Bottom panel: same histograms as shown in the top panel, but for the PNe classified using the traditional classification criteria.
Current usage metrics show cumulative count of Article Views (full-text article views including HTML views, PDF and ePub downloads, according to the available data) and Abstracts Views on Vision4Press platform.
Data correspond to usage on the plateform after 2015. The current usage metrics is available 48-96 hours after online publication and is updated daily on week days.
Initial download of the metrics may take a while.