Fig. 13
Download original image
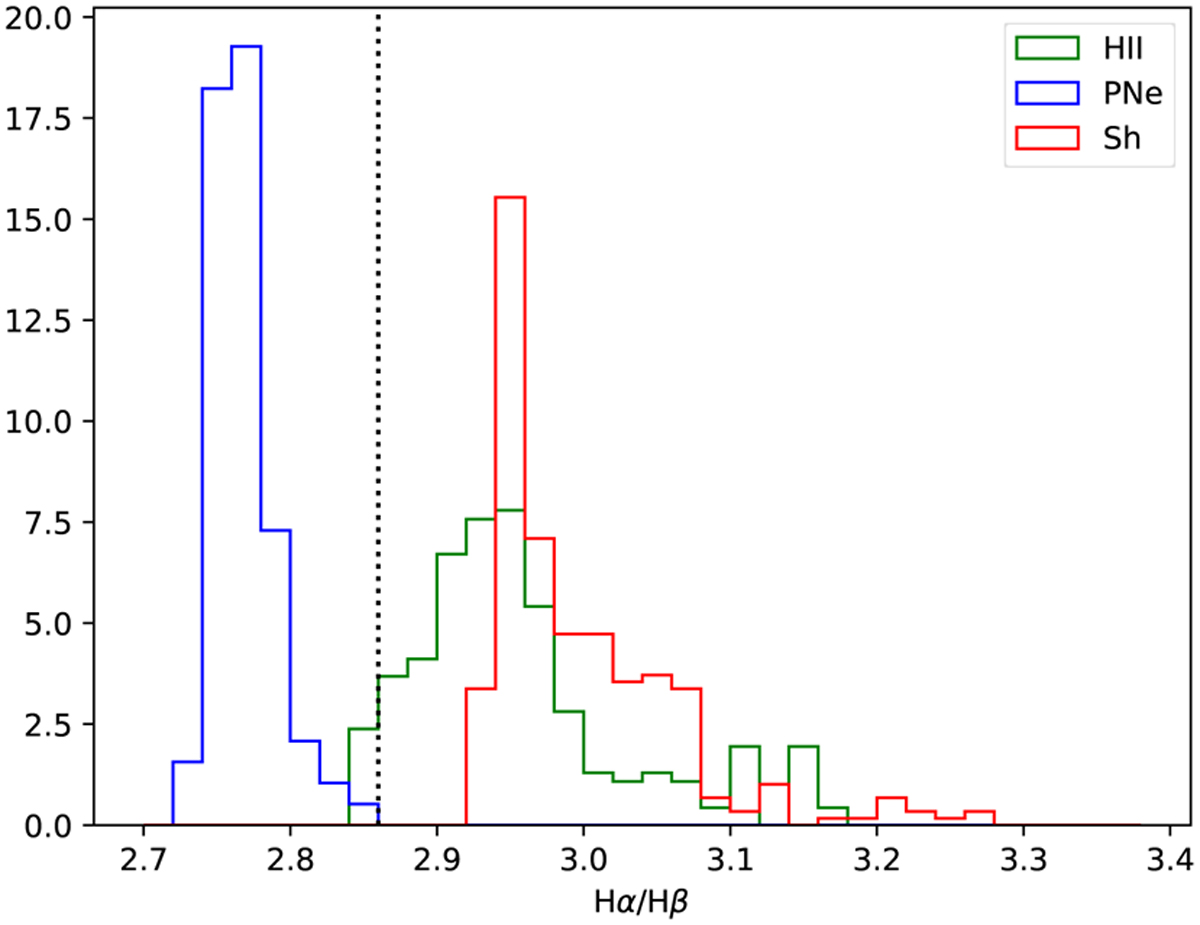
Histogram showing the intrinsic Hα/Hβ ratio for the different grids of models used in the classification procedure. Histograms are coloured following the usual convention for H II regions, PNe and shocks. The vertical dashed line represents the theoretical value of the Hα/Hβ ratio for Case B conditions and a temperature of 104 K, typically assumed when recovering the extinction from the observed Hα/Hβ ratio in H II regions.
Current usage metrics show cumulative count of Article Views (full-text article views including HTML views, PDF and ePub downloads, according to the available data) and Abstracts Views on Vision4Press platform.
Data correspond to usage on the plateform after 2015. The current usage metrics is available 48-96 hours after online publication and is updated daily on week days.
Initial download of the metrics may take a while.