Fig. 12
Download original image
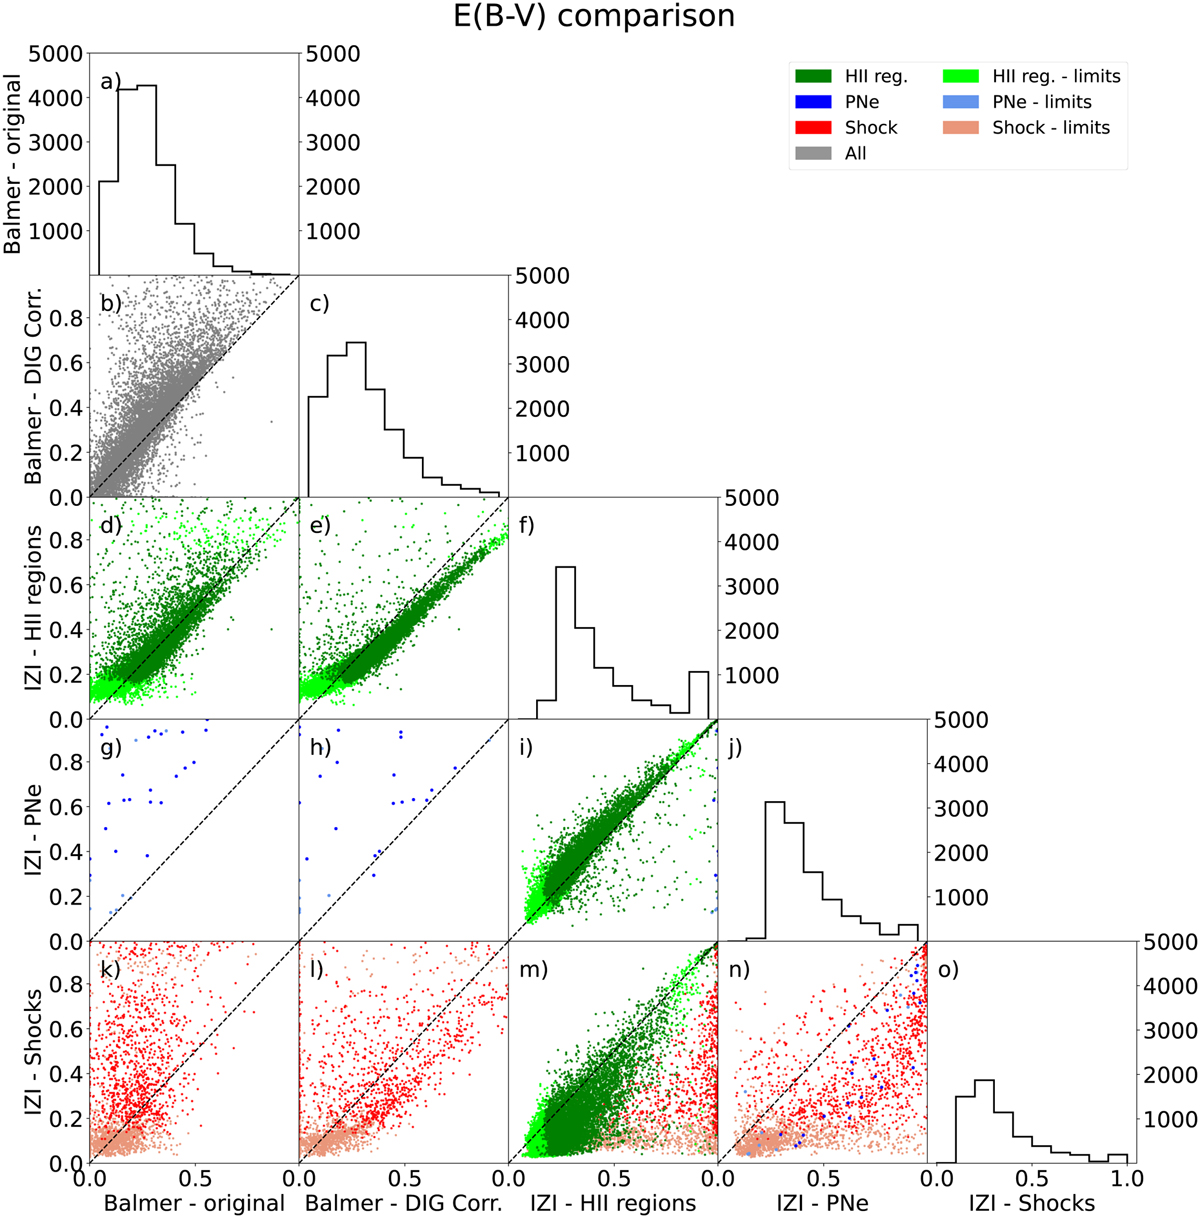
Corner plot comparing the reddening value (E(B − V)) measured directly from the data (before and after the correction for DIG contribution) with the values obtained by IZI using the three different grids of models used in the classification algorithm (H II regions, PNe and Shocks). Only the regions belonging to the BPT sample are considered in this plot (see Sect. 6.1). In each plot, the coloured points represent the nebulae we could classify with our algorithm, following the usual convention. Only the points belonging to the grids considered by the specific panel are coloured. The plots on the matrix’s diagonal show regions’ distribution as a function of E(B − V) for each method.
Current usage metrics show cumulative count of Article Views (full-text article views including HTML views, PDF and ePub downloads, according to the available data) and Abstracts Views on Vision4Press platform.
Data correspond to usage on the plateform after 2015. The current usage metrics is available 48-96 hours after online publication and is updated daily on week days.
Initial download of the metrics may take a while.