Fig. 1
Download original image
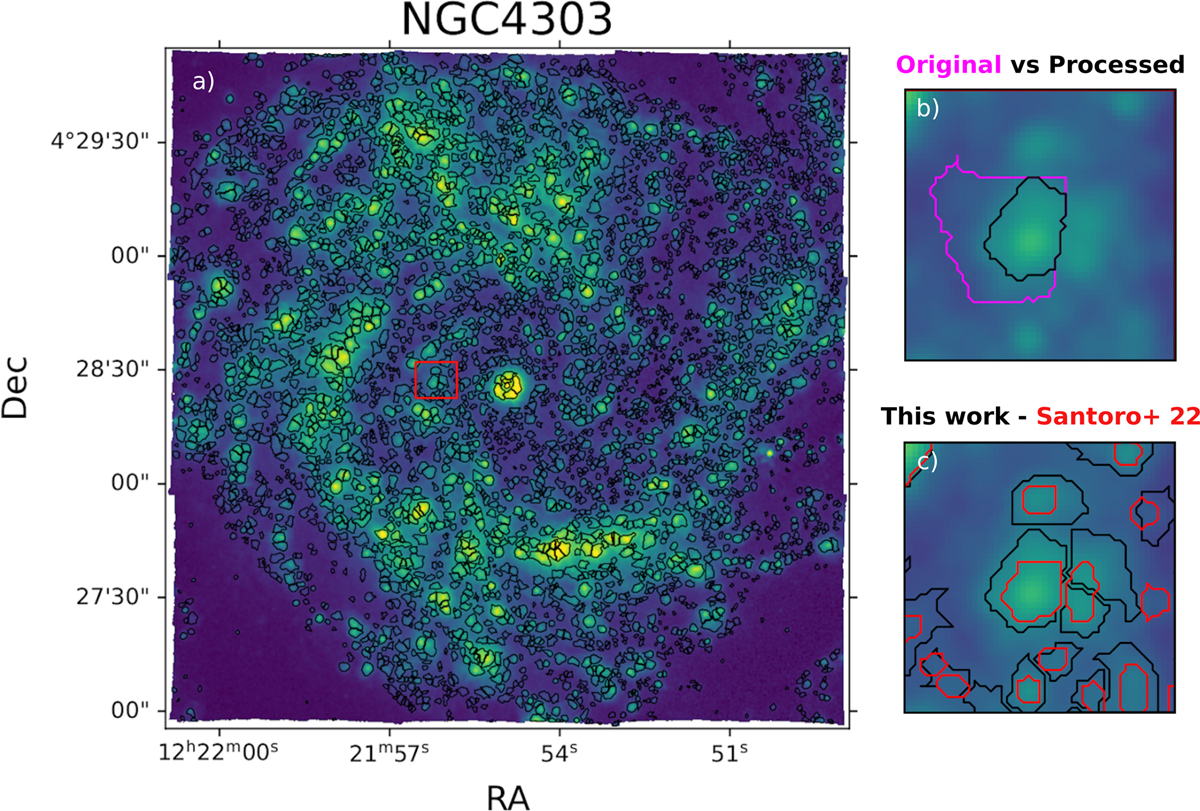
NGC4303 segmentation map. Panel a: Map of the S/N-weighted combination of the [O III]λ5007, Hα and [S II]λλ6717,6731 lines (our detection image) of NGC 4303 used for the identification of the nebulae with the final segmentation map (after the post-processing), shown in black contours. The red box highlights the area shown in panels b and c. Panel b: Zoom-in on a small region of the galaxy showing the difference between the original CLUMPFIND region boundaries (in magenta) and those that result after the post-processing described in Sect. 4.2 (in black, only one region is shown). Panel c: Zoom-in on the same area of panel b showing the difference between our new segmentation map (black) and that produced by S22 (red). As is clear in this panel we find that our regions are larger on average, but also the segmentation for some regions is different.
Current usage metrics show cumulative count of Article Views (full-text article views including HTML views, PDF and ePub downloads, according to the available data) and Abstracts Views on Vision4Press platform.
Data correspond to usage on the plateform after 2015. The current usage metrics is available 48-96 hours after online publication and is updated daily on week days.
Initial download of the metrics may take a while.