Fig. 4
Download original image
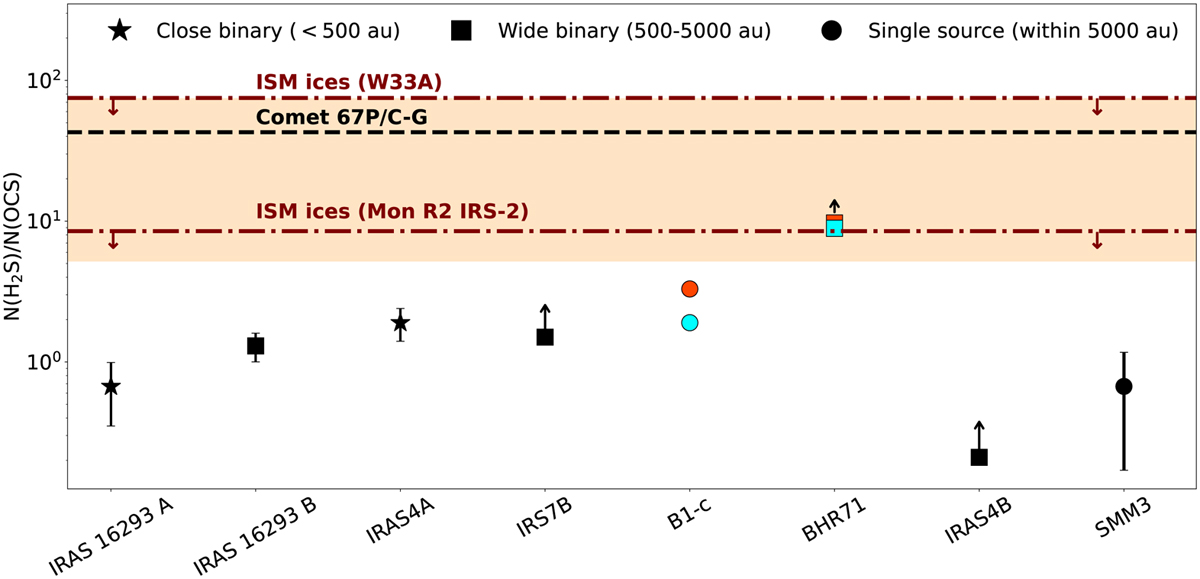
N(H2S)/N(OCS) of the studied sources. Different symbols represent different types of sources: “star” for close binary (<500 au), “square” for wide binary (500–5000 au), and “circle” for single sources (within 5000 au). The upper limits on the interstellar ice (W33A and Mon R2 IRS2) ratios are shown by downward arrows. The uncertainty on the H2S/OCS ratio in comet 67P/C-G is shown by the coral shaded region. The lower limit on the ratio in IRS7B is shown by an upwards arrow. The H2S/OCS ratios for the cold (cyan) and warm (orange) components of Bl-c, and cold (cyan) component of BHR7l -1RS 1 are the best-available estimates pending opacity issues. These latter three data points do not have error bars associated to them in the figure (so as to indicate that they are merely estimates).
Current usage metrics show cumulative count of Article Views (full-text article views including HTML views, PDF and ePub downloads, according to the available data) and Abstracts Views on Vision4Press platform.
Data correspond to usage on the plateform after 2015. The current usage metrics is available 48-96 hours after online publication and is updated daily on week days.
Initial download of the metrics may take a while.