Figure I.1
Download original image
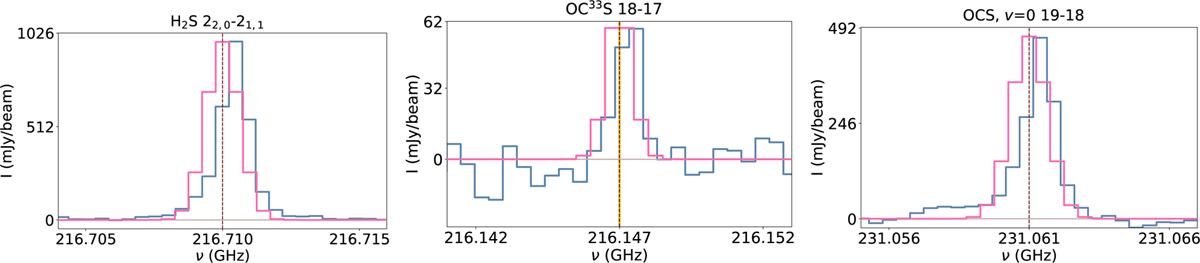
Observed spectra (in blue), rest frequency of the detected line (brown dashed line), spectroscopic uncertainty on the rest frequency of the detected line (yellow shaded region), and fitted synthetic spectra (in pink) plotted for the sulfur-bearing species detected toward NGC 1333-IRAS4B for Tex = 100 K and a source size of 1″.
Current usage metrics show cumulative count of Article Views (full-text article views including HTML views, PDF and ePub downloads, according to the available data) and Abstracts Views on Vision4Press platform.
Data correspond to usage on the plateform after 2015. The current usage metrics is available 48-96 hours after online publication and is updated daily on week days.
Initial download of the metrics may take a while.