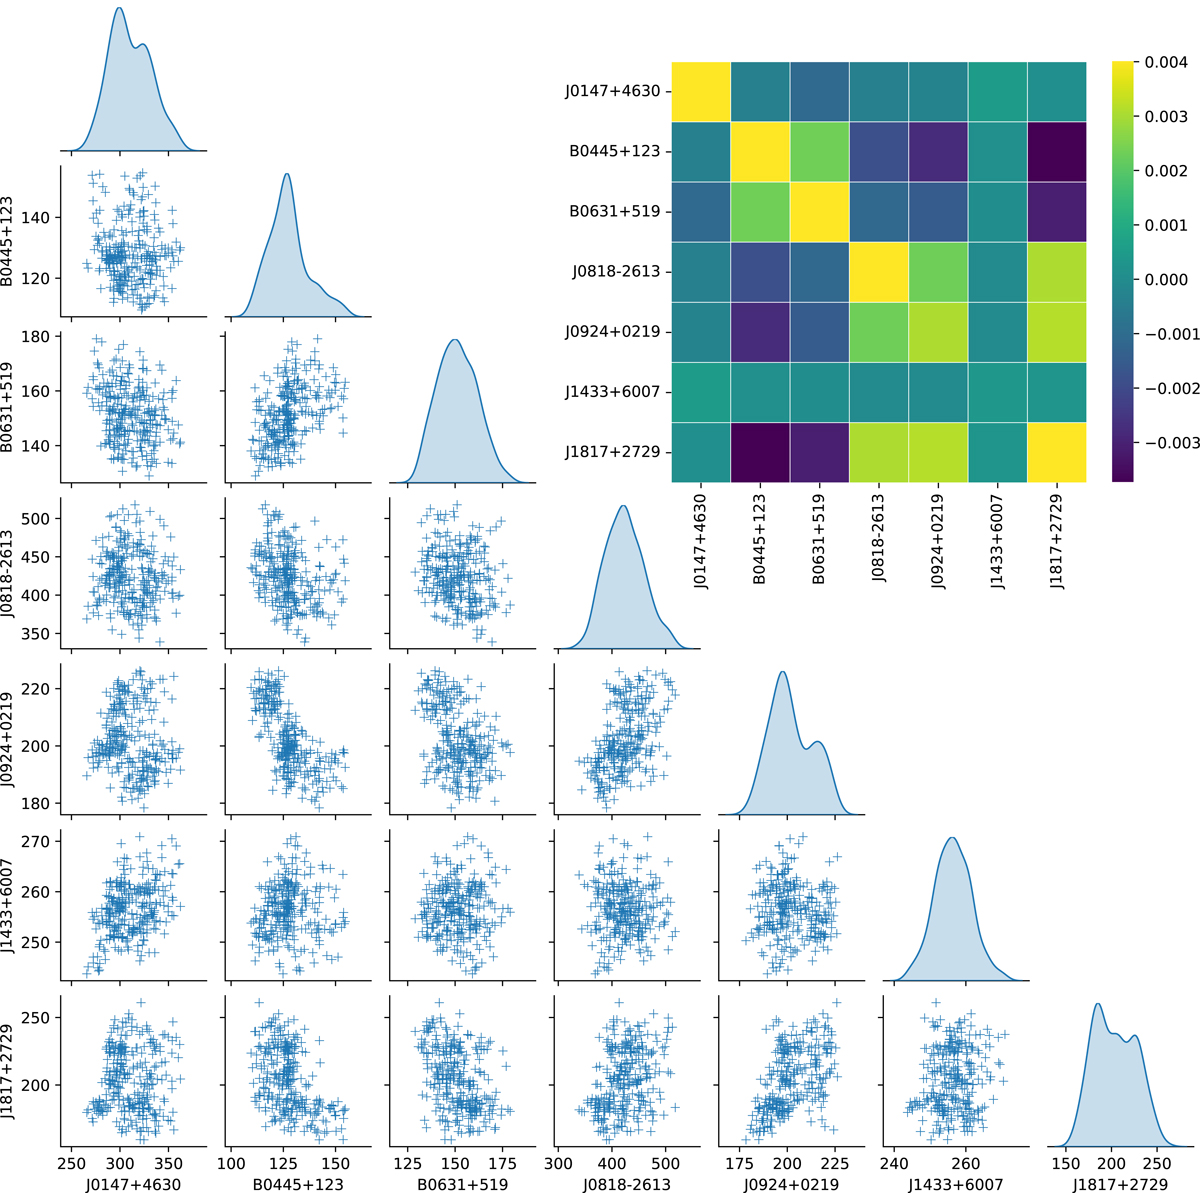
Fig. 6.
Download original image
Illustration showing relations among the velocity dispersion measurements of the deflectors. The scatter plots between each pair of deflectors show corresponding velocity dispersion measurements for three hundred setups where each marker shows the measurements from the same setup. The blue-shaded curves are the individual velocity dispersion distributions of the deflectors. The set-ups were varied by changing the wavelength ranges, set of the spectra of the templates, and degree of the additive polynomial. In general, the covariance terms are negligible except in a few cases, for which they should be taken into account. The lens system J0659+1629 has been excluded from this analysis as the extracted deflector spectrum for this system only covers a small wavelength range. The plot in the upper-right shows a heat-map of the covariance matrix calculated from these velocity dispersion measurements, where the measurements were normalized to their respective mean.
Current usage metrics show cumulative count of Article Views (full-text article views including HTML views, PDF and ePub downloads, according to the available data) and Abstracts Views on Vision4Press platform.
Data correspond to usage on the plateform after 2015. The current usage metrics is available 48-96 hours after online publication and is updated daily on week days.
Initial download of the metrics may take a while.