Fig. 3.
Download original image
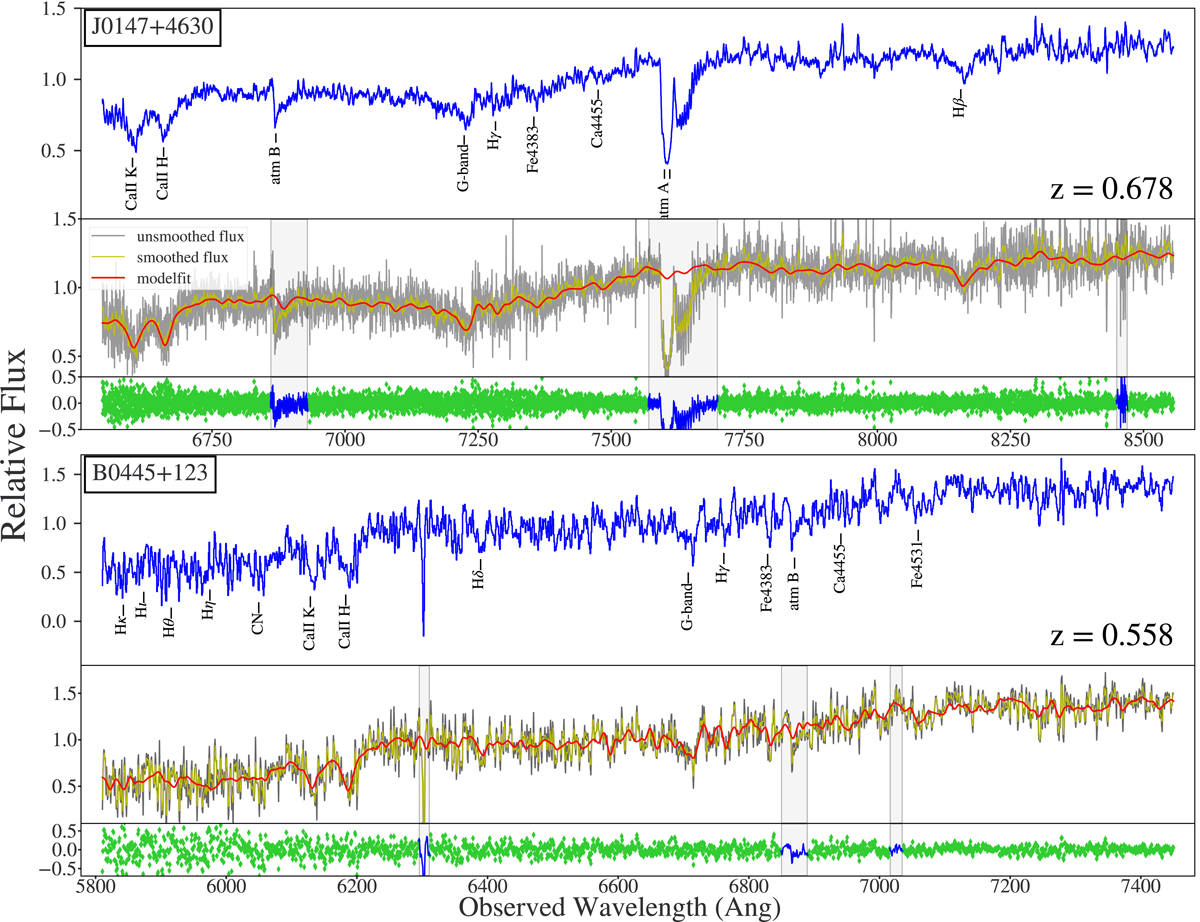
1D spectra and velocity dispersion fits for the deflectors from the lens system J0147+4630 and B0445+123. The plot for each system consists of three panels. Top panel: the extracted and smoothed 1D spectrum of the deflector is plotted over the observed wavelength where the smoothing has been done using a boxcar filter of size around 2.5 Å. Prominent stellar and telluric absorption lines are marked if present. And the measured redshift of the deflector is mentioned in the lower right corner of the plot. Middle panel: the pPXF generated model fit (red) to measure the velocity dispersion is plotted on top of the original unsmoothed spectrum (black). A smoothed version (yellow) of the original spectrum is also presented to show the goodness of the fit. The grey parts are the masked or excluded regions from the fit. Bottom panel: the green dots show the residuals between the unsmoothed flux and the model fit for each wavelength normalized to the respective model fits.
Current usage metrics show cumulative count of Article Views (full-text article views including HTML views, PDF and ePub downloads, according to the available data) and Abstracts Views on Vision4Press platform.
Data correspond to usage on the plateform after 2015. The current usage metrics is available 48-96 hours after online publication and is updated daily on week days.
Initial download of the metrics may take a while.