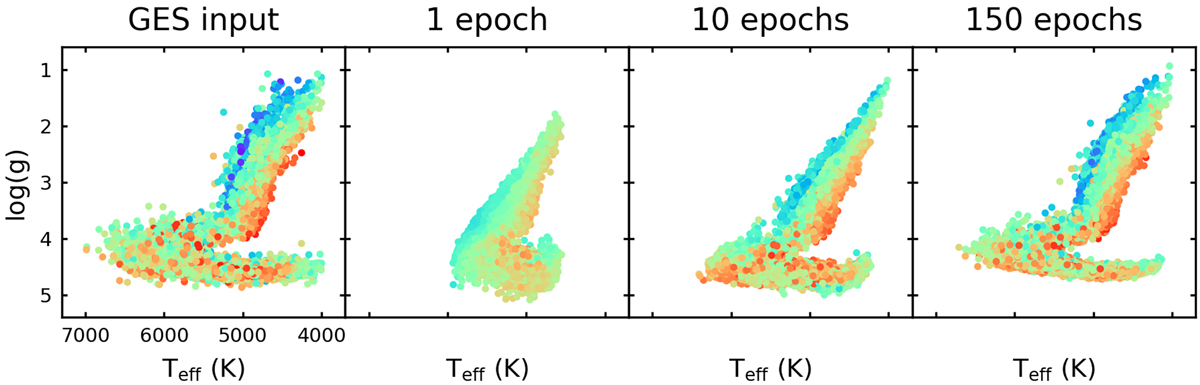
Fig. 6.
Download original image
Evolution of the prediction-based Kiel diagram during the network training. The far-left panel shows the Kiel diagram based on the GES input values of Teff and log(g). Succeeding panels show the Kiel diagram based on network predictions after 1, 10, and 150 training epochs. The color-coding, indicating the [Fe/H] values of each data point, is on the same scale as in Fig. 2.
Current usage metrics show cumulative count of Article Views (full-text article views including HTML views, PDF and ePub downloads, according to the available data) and Abstracts Views on Vision4Press platform.
Data correspond to usage on the plateform after 2015. The current usage metrics is available 48-96 hours after online publication and is updated daily on week days.
Initial download of the metrics may take a while.