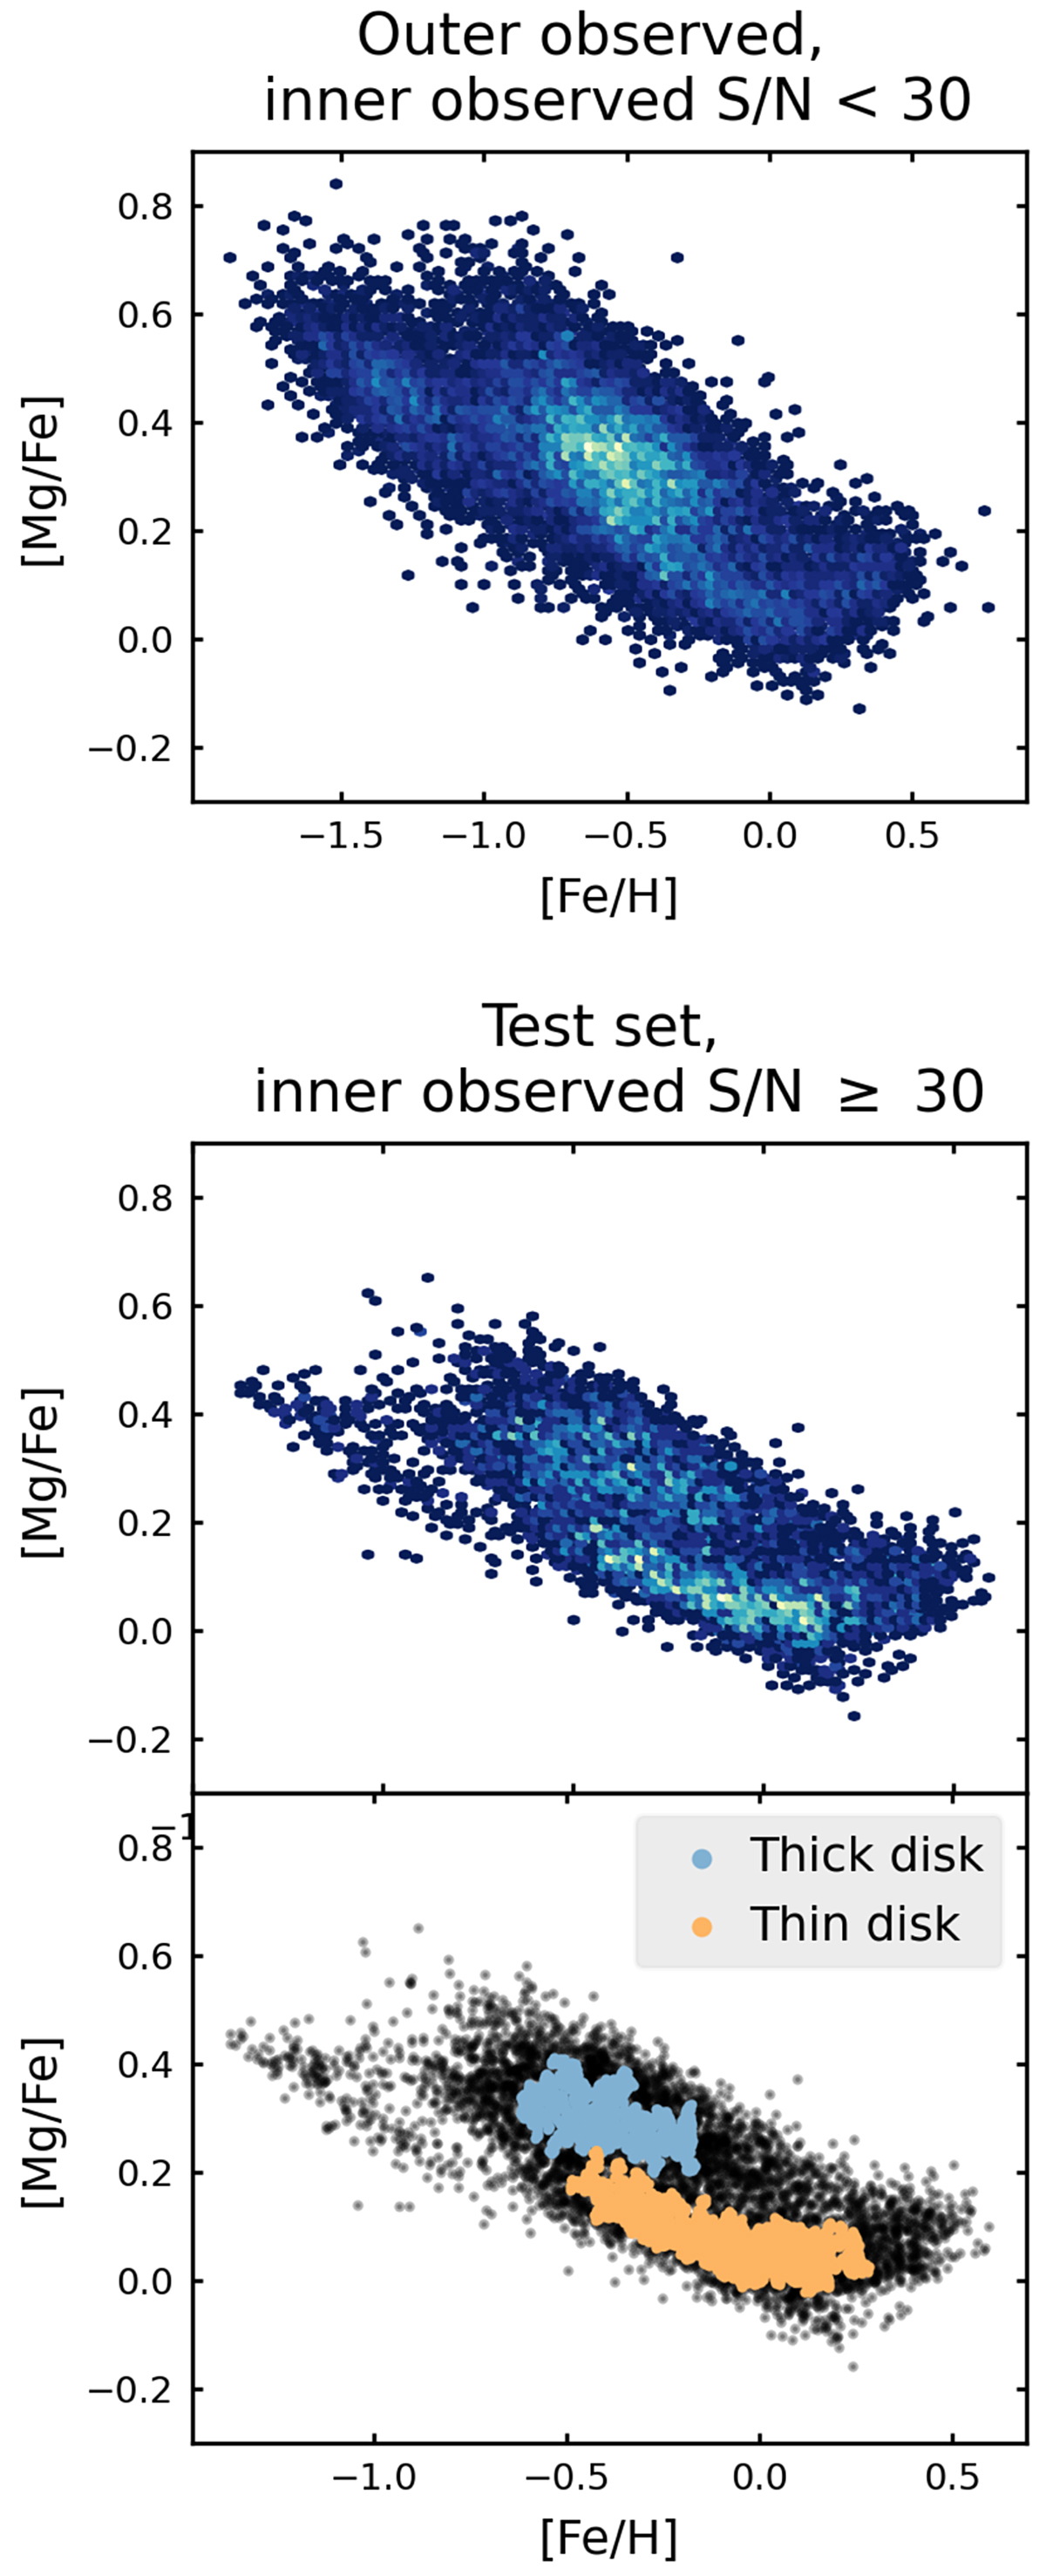
Fig. 17.
Download original image
Chemical separation between thin- and thick-disk stars. Top panel: density map of the [Mg/Fe] vs. [Fe/H] distribution of our CNN results for the low S/N inner + outer observed sets. Brighter colors indicate a higher density of data points (linear color scale). Bottom panels: same plot as in the top panel, but for the stars in the test and inner observed set with S/N ≥ 30. Thin and thick disk populations found by the HDBSCAN algorithm are shown at the bottom. The two populations correspond to the two dense regions in the panel above.
Current usage metrics show cumulative count of Article Views (full-text article views including HTML views, PDF and ePub downloads, according to the available data) and Abstracts Views on Vision4Press platform.
Data correspond to usage on the plateform after 2015. The current usage metrics is available 48-96 hours after online publication and is updated daily on week days.
Initial download of the metrics may take a while.