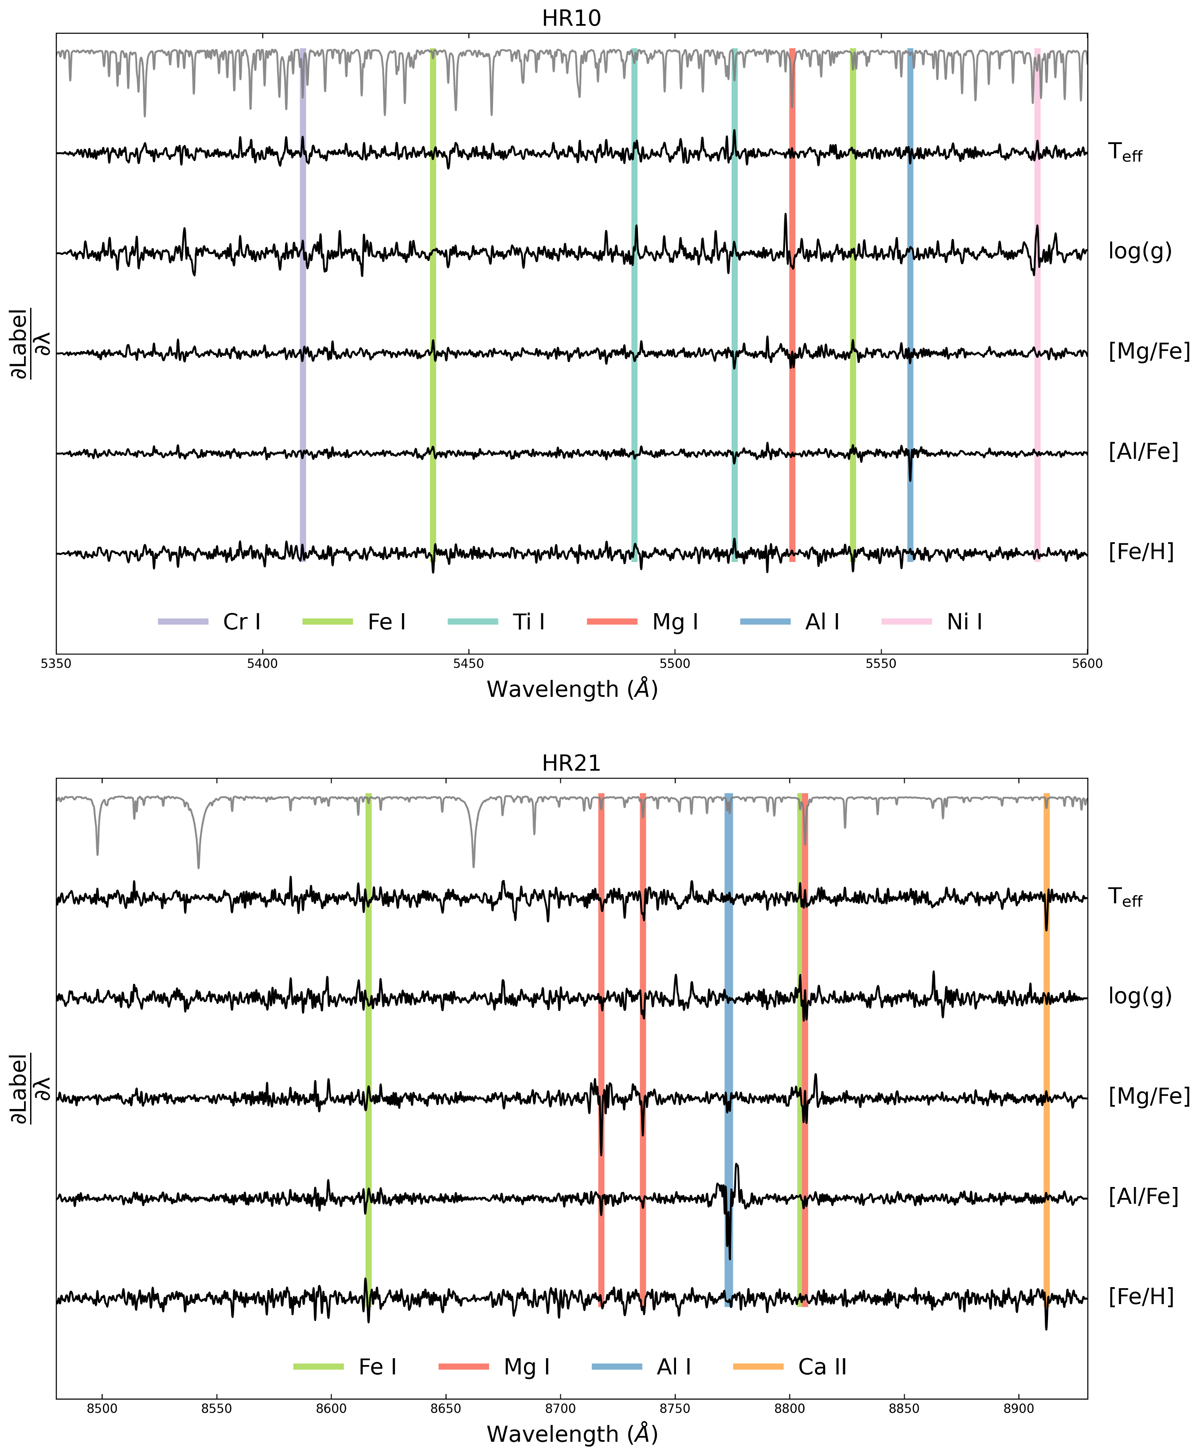
Fig. 11.
Download original image
Network gradients for our five labels as a function of wavelength (black). Top panel shows the gradients across the GIRAFFE setup HR10. Bottom panel shows the same for the HR21 setup. An average input spectrum is shown in gray as the top line in both panels. The locations of selected absorption lines of different elements are marked with vertical colored lines. The highlighted Mg and Al lines were used by GES for the determination of our input Mg and Al abundances. Their wavelengths are 5528.41, 8717.81, 8736.02, and 8806.756 Å for Mg and 5557.06, 8772.87, and 8773.90 Å for Al (Heiter et al. 2021).
Current usage metrics show cumulative count of Article Views (full-text article views including HTML views, PDF and ePub downloads, according to the available data) and Abstracts Views on Vision4Press platform.
Data correspond to usage on the plateform after 2015. The current usage metrics is available 48-96 hours after online publication and is updated daily on week days.
Initial download of the metrics may take a while.