Fig. 10.
Download original image
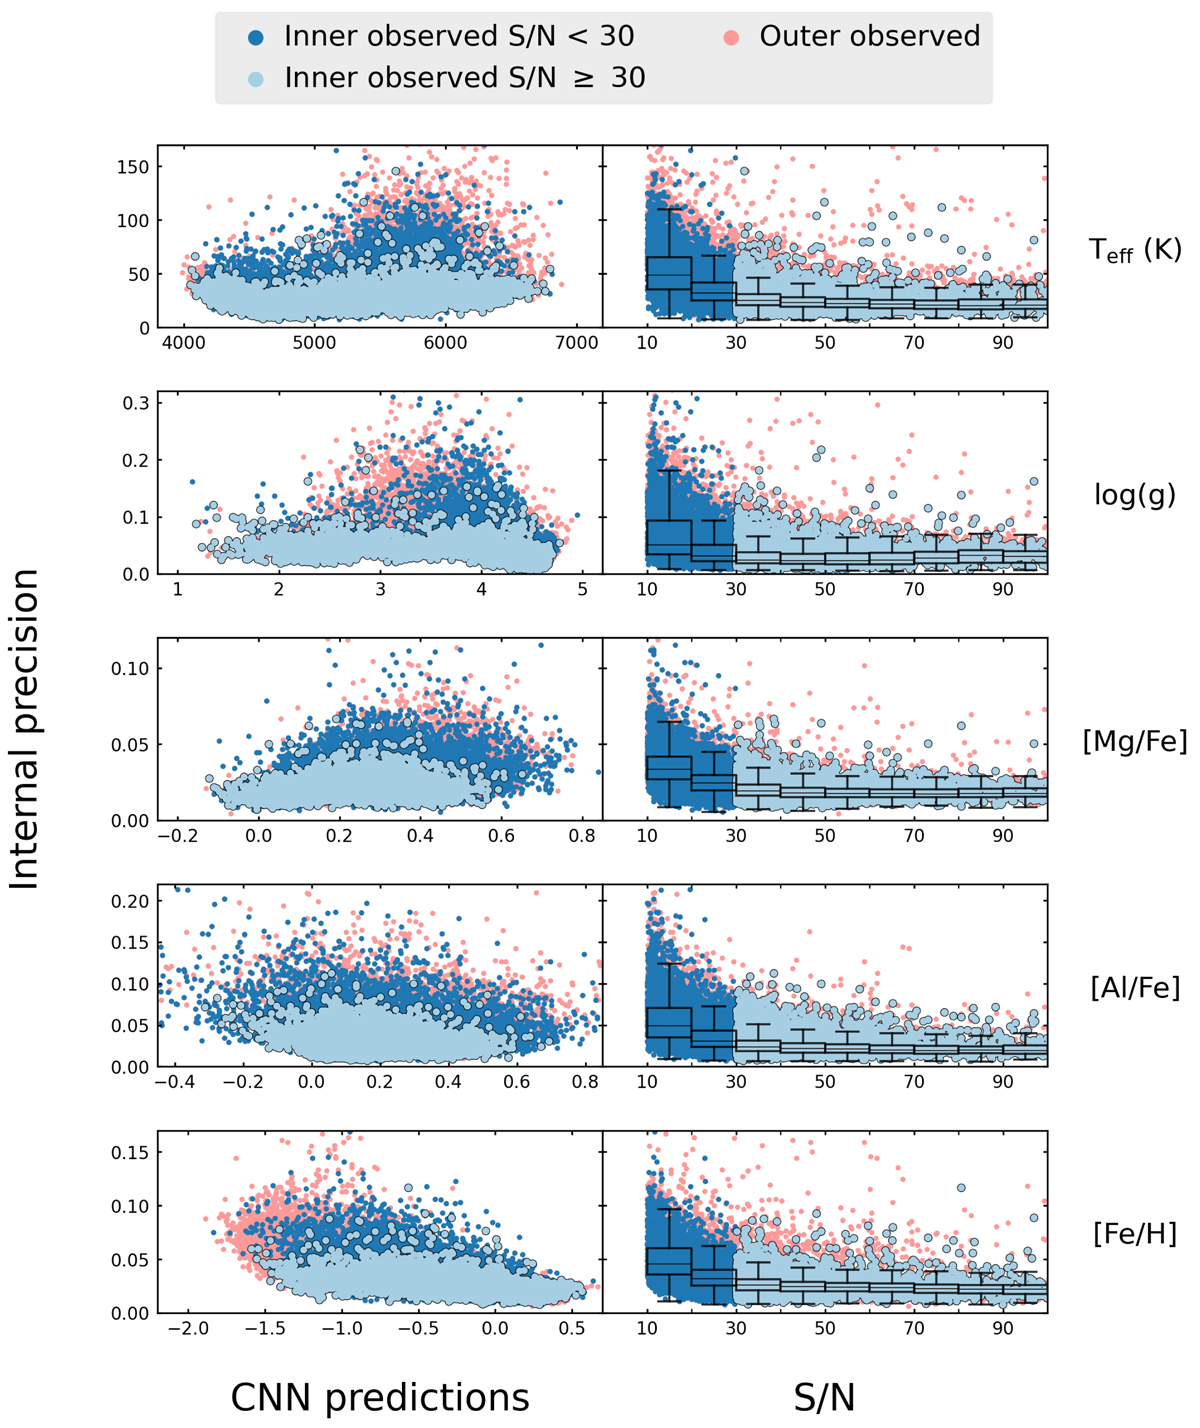
Internal precision of our CNN results for the inner observed set with S/N ≥ 30 (light blue), with S/N < 30 (dark blue) and the outer observed set (red). The left panels show the internal precision relative to the absolute CNN label values, the right panels show the precision relative to the spectra S/N. The boxplots in the right panels show the median and spread of the uncertainties of the whole observed set, in S/N bins of width 10, starting at S/N = 10.
Current usage metrics show cumulative count of Article Views (full-text article views including HTML views, PDF and ePub downloads, according to the available data) and Abstracts Views on Vision4Press platform.
Data correspond to usage on the plateform after 2015. The current usage metrics is available 48-96 hours after online publication and is updated daily on week days.
Initial download of the metrics may take a while.