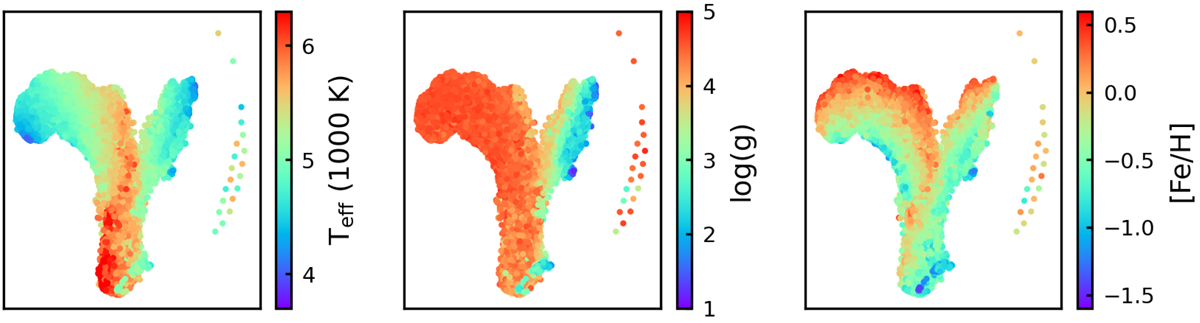
Fig. 1.
Download original image
t-SNE similarity map of our sample GIRAFFE spectra. The three panels show the same map, each color-coded with a different physical parameter. While the relative distance of points in the map indicate the degree of similarity of the corresponding spectra, their X and Y coordinates themselves have no physical meaning. The map in this figure has been computed with perplexity 30. For our data, perplexity values between 20 and 50 produce qualitatively identical results.
Current usage metrics show cumulative count of Article Views (full-text article views including HTML views, PDF and ePub downloads, according to the available data) and Abstracts Views on Vision4Press platform.
Data correspond to usage on the plateform after 2015. The current usage metrics is available 48-96 hours after online publication and is updated daily on week days.
Initial download of the metrics may take a while.