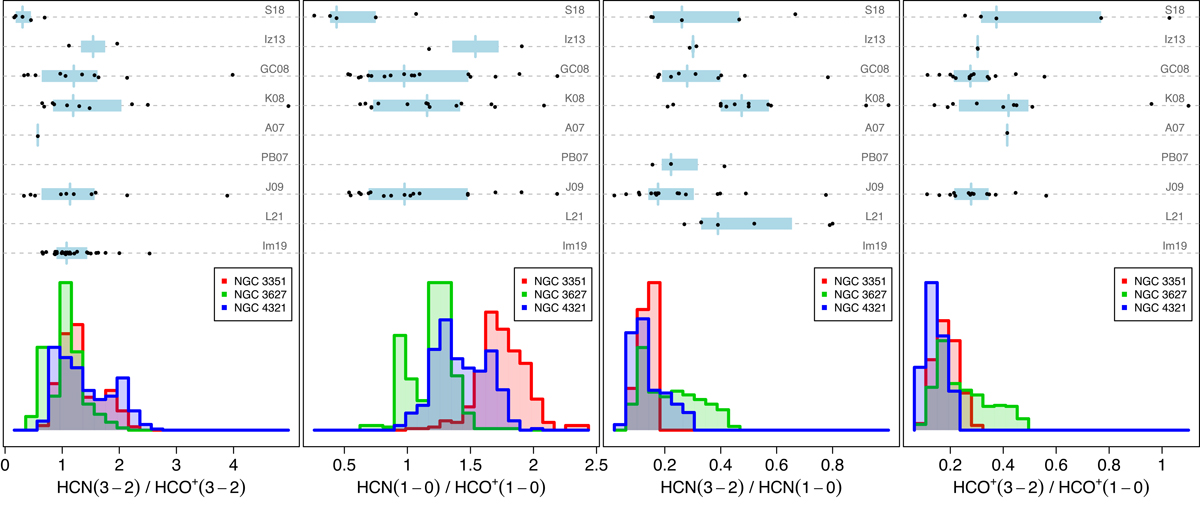
Fig. A.2.
Download original image
Histograms per galaxy of four line ratios as in Fig. 4. Here we show literature data as black dots for comparison. In each row, the label corresponds to the paper from which the measurements are taken (see text for details), while a light-blue shaded bar indicates the 25th-75th percentile range of the data set and a vertical segment indicates the median.
Current usage metrics show cumulative count of Article Views (full-text article views including HTML views, PDF and ePub downloads, according to the available data) and Abstracts Views on Vision4Press platform.
Data correspond to usage on the plateform after 2015. The current usage metrics is available 48-96 hours after online publication and is updated daily on week days.
Initial download of the metrics may take a while.