Fig. 6.
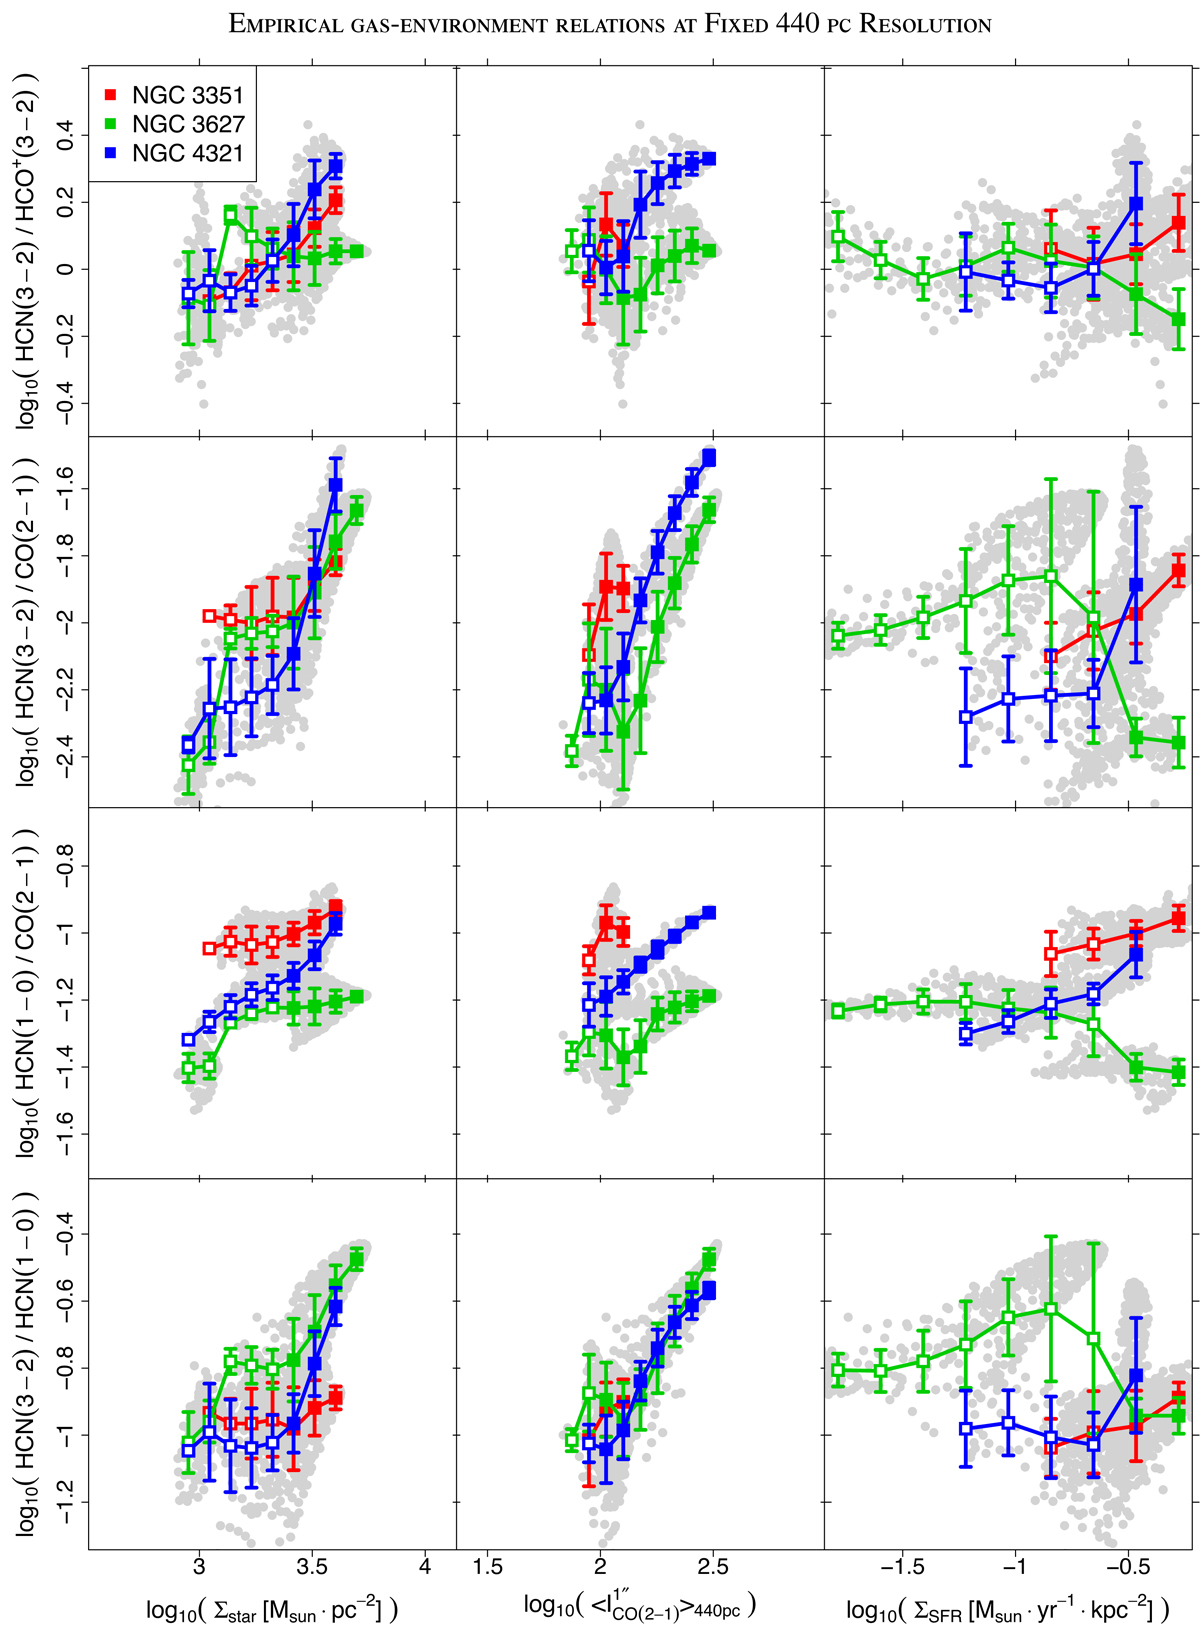
Download original image
Same line ratios as in Fig. 3 plotted against Σstar (left), ⟨ICO⟩ (middle), and ΣSFR (right) on a pixel-by-pixel basis (grey points). All panels have the same vertical and horizontal span in dex for an easier comparison. For each line ratio and galaxy, the colour squares and vertical bars represent the mean and the ±1σ standard deviation within bins of the x-axis parameter. The squares are white-filled where the mean value does not necessarily represent the whole galaxy (Sect. 6).
Current usage metrics show cumulative count of Article Views (full-text article views including HTML views, PDF and ePub downloads, according to the available data) and Abstracts Views on Vision4Press platform.
Data correspond to usage on the plateform after 2015. The current usage metrics is available 48-96 hours after online publication and is updated daily on week days.
Initial download of the metrics may take a while.