Open Access
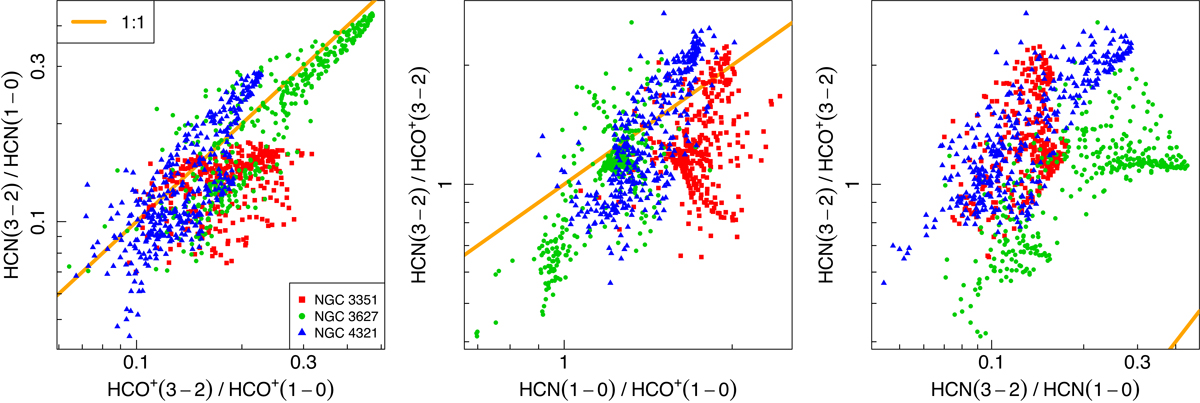
Fig. 5.
Download original image
Ratio vs. ratio diagnostic plots combining the HCN and HCO+J = 1–0 and 3–2 lines. Each dot corresponds to one pixel in our galaxies, coloured by target. The orange lines are one-to-one linear relations.
Current usage metrics show cumulative count of Article Views (full-text article views including HTML views, PDF and ePub downloads, according to the available data) and Abstracts Views on Vision4Press platform.
Data correspond to usage on the plateform after 2015. The current usage metrics is available 48-96 hours after online publication and is updated daily on week days.
Initial download of the metrics may take a while.