Fig. 1.
Download original image
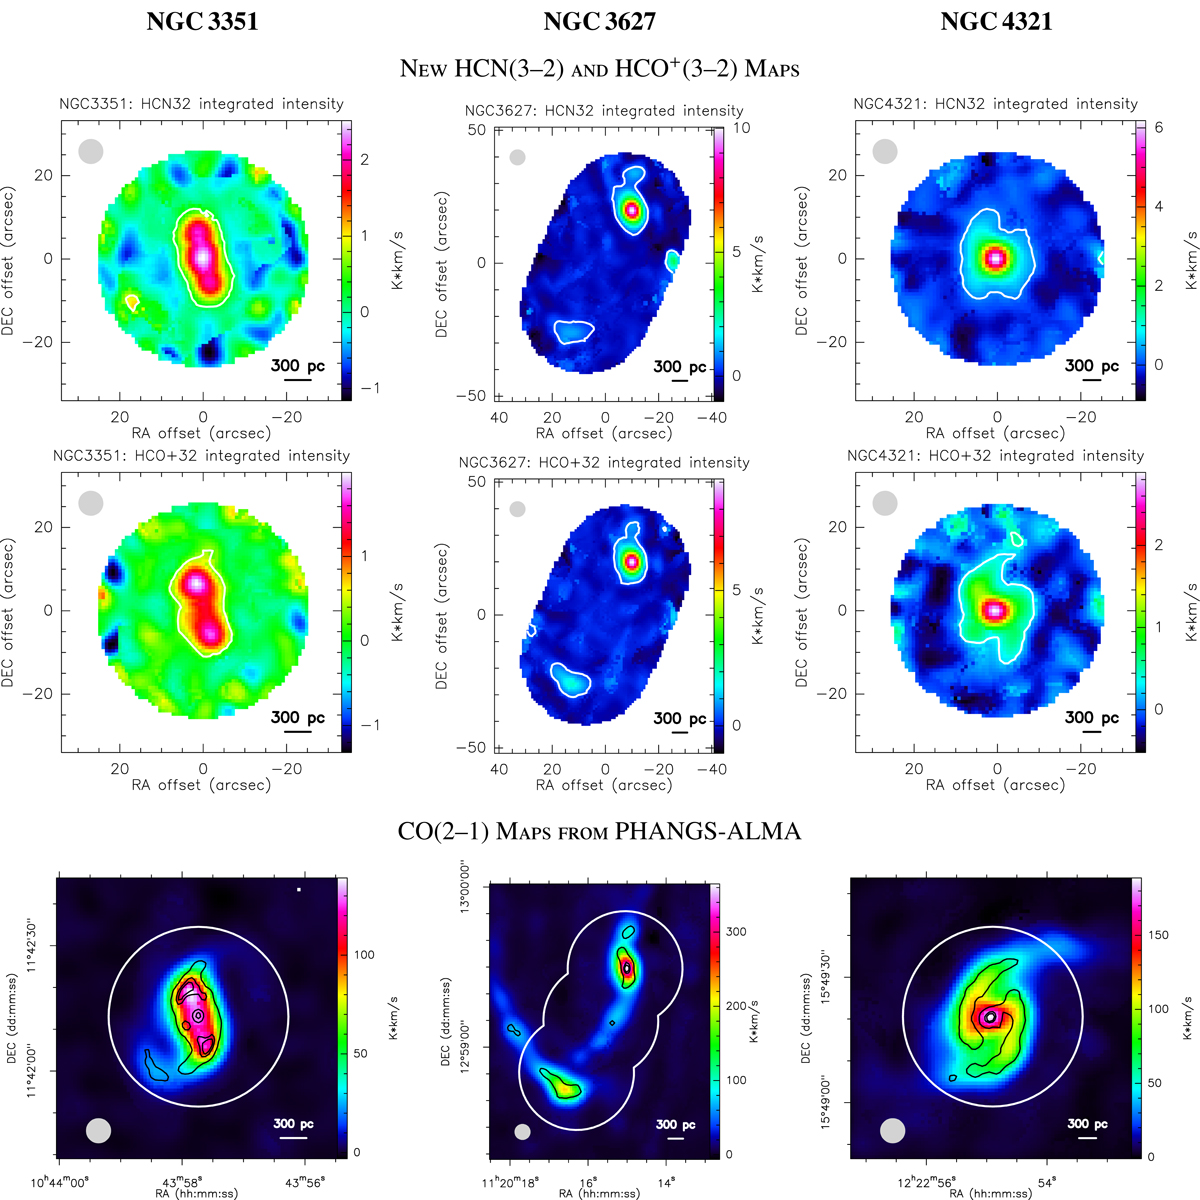
Integrated intensity maps at 6″ resolution of NGC 3351, NGC 3627, and NGC 4321 from left to right. Top and middle rows: HCN(3–2) and HCO+(3–2) maps. The white contours correspond to S/N = 5 and the grey circles represent the 6″ beam. Offsets are relative to the positions in Table 1. Bottom row: PHANGS-ALMA CO(2–1) maps. Black contours correspond to 10, 30, 50, and 70% of the maximum in each CO(2–1) image at the native ∼1.5″ resolution. The white circles indicate the fields of the HCN(3–2) and HCO+(3–2) observations with the ACA.
Current usage metrics show cumulative count of Article Views (full-text article views including HTML views, PDF and ePub downloads, according to the available data) and Abstracts Views on Vision4Press platform.
Data correspond to usage on the plateform after 2015. The current usage metrics is available 48-96 hours after online publication and is updated daily on week days.
Initial download of the metrics may take a while.