Fig. 8
Download original image
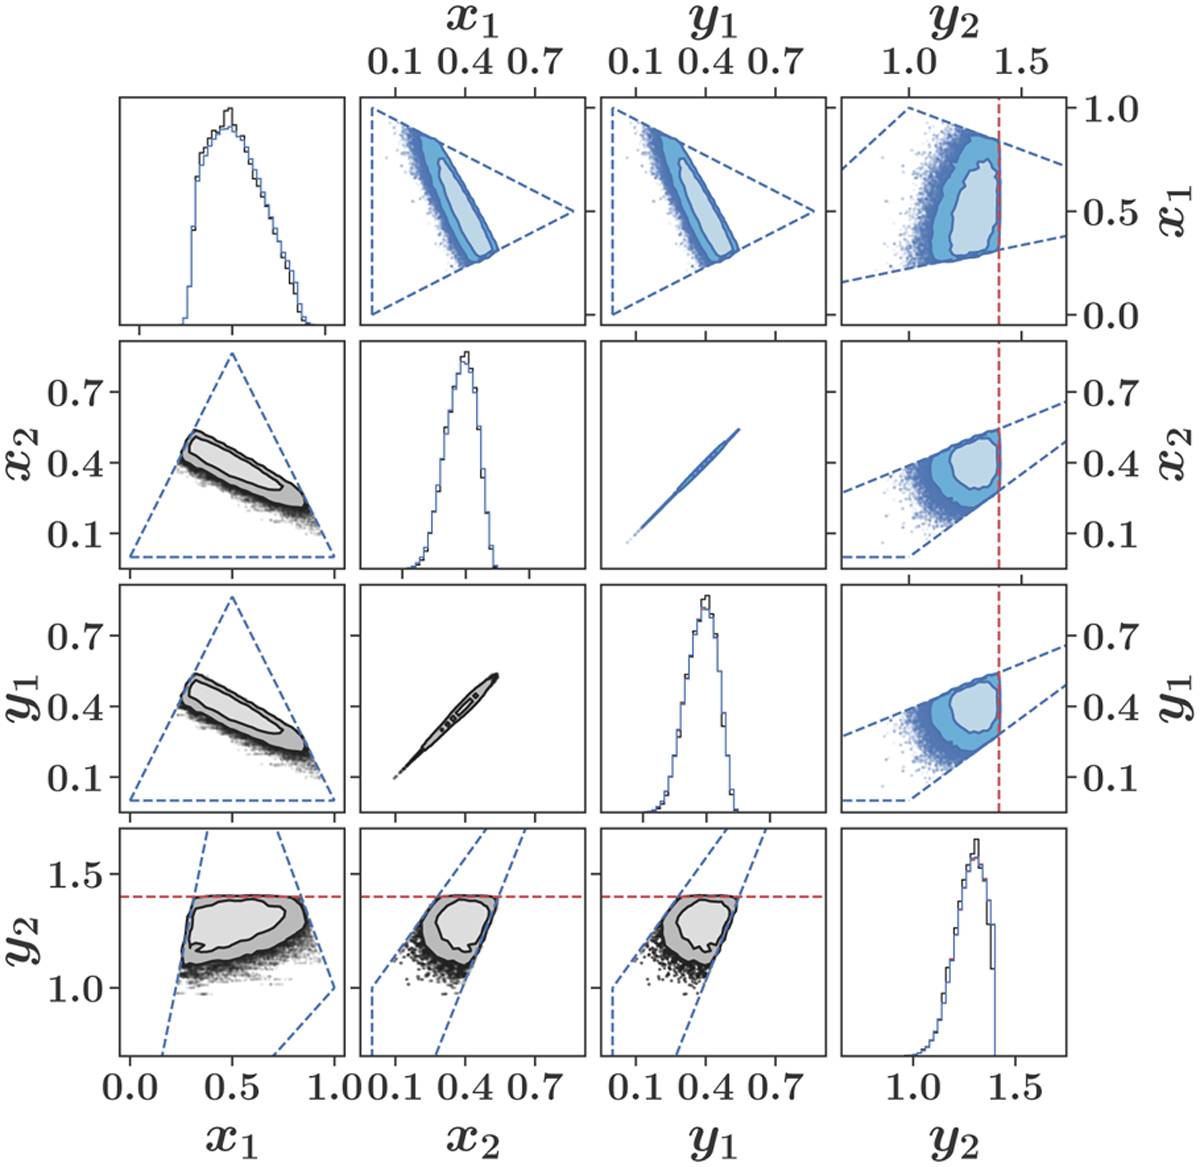
Comparison of the cINN and an MCMC method when applied to the toy model. The data in the lower triangle (black) were predicted by the cINN method, and the data in the upper triangle (blue) were generated with an MCMC sampler. The dashed blue lines indicate the boundaries of the prior domain, outside of which the prior probability is zero. The dashed red line indicates the upper limit on y2 as in Eq. (36). The histograms of the analytical solution are omitted since they overlap with the MCMC data. The light shaded areas in the 2D scatter plots indicate the 68% HDR, and the dark shaded areas are the 89%-HDR.
Current usage metrics show cumulative count of Article Views (full-text article views including HTML views, PDF and ePub downloads, according to the available data) and Abstracts Views on Vision4Press platform.
Data correspond to usage on the plateform after 2015. The current usage metrics is available 48-96 hours after online publication and is updated daily on week days.
Initial download of the metrics may take a while.