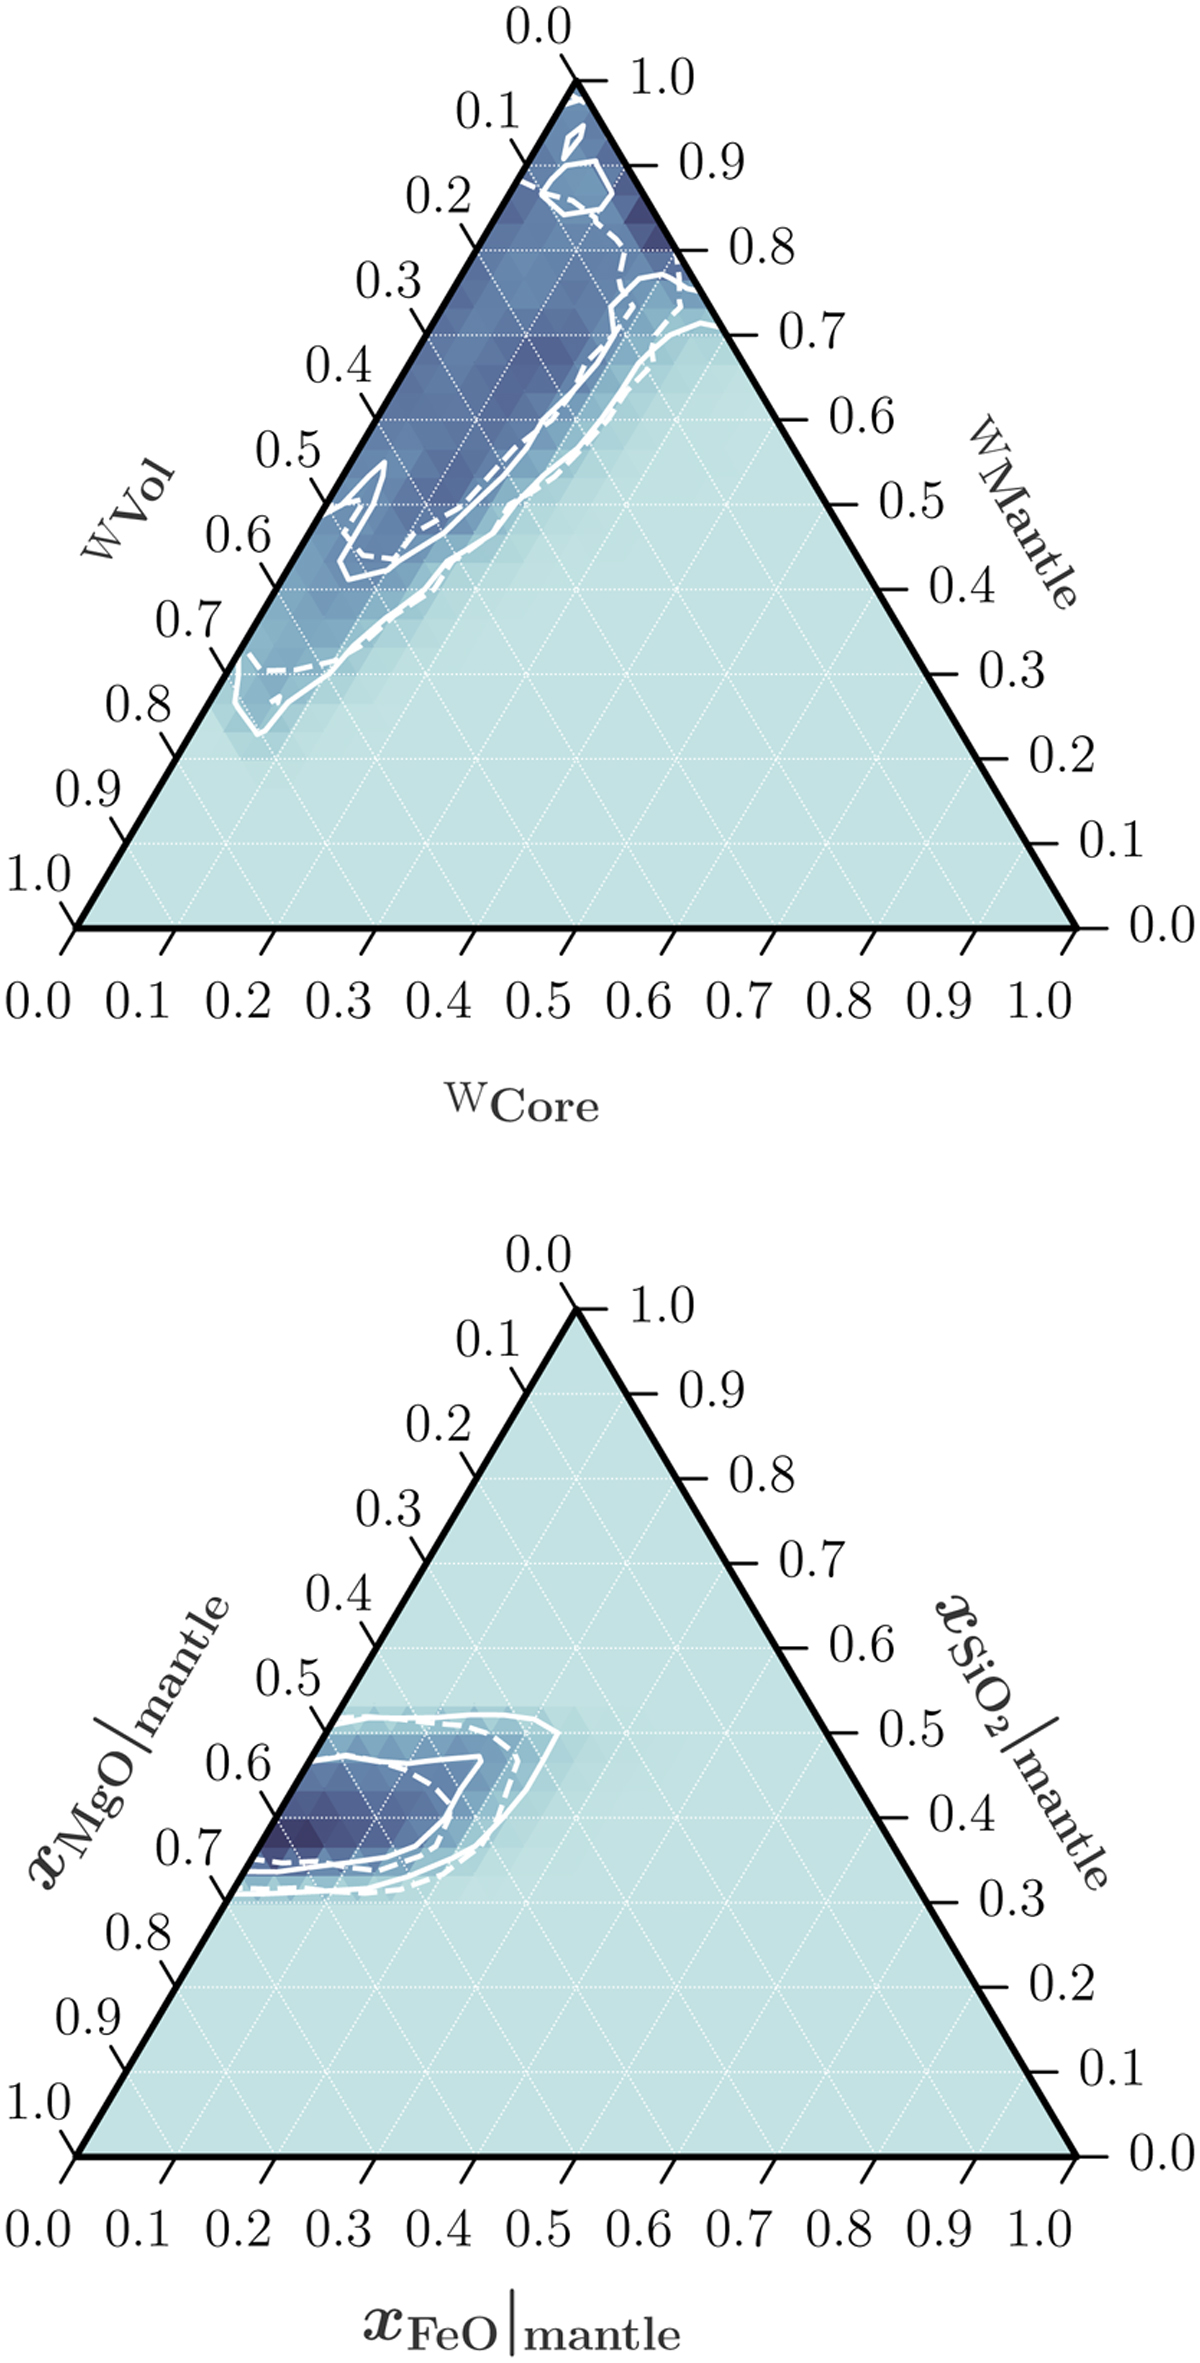
Fig. 14
Download original image
Ternary diagrams of the cINN prediction. Top panel: kernel density estimate of the layer mass fractions as determined with the cINN. Bottom panel: kernel density estimate of the mantle composition. The kernel density in both panels was estimated using a Gaussian kernel with a standard deviation of 0.2. The white lines indicate the contours of the 68% HDR and 95% HDR. For comparison, the HDR from the posterior calculated with the MCMC is also shown (dashed lines).
Current usage metrics show cumulative count of Article Views (full-text article views including HTML views, PDF and ePub downloads, according to the available data) and Abstracts Views on Vision4Press platform.
Data correspond to usage on the plateform after 2015. The current usage metrics is available 48-96 hours after online publication and is updated daily on week days.
Initial download of the metrics may take a while.