Fig. 12
Download original image
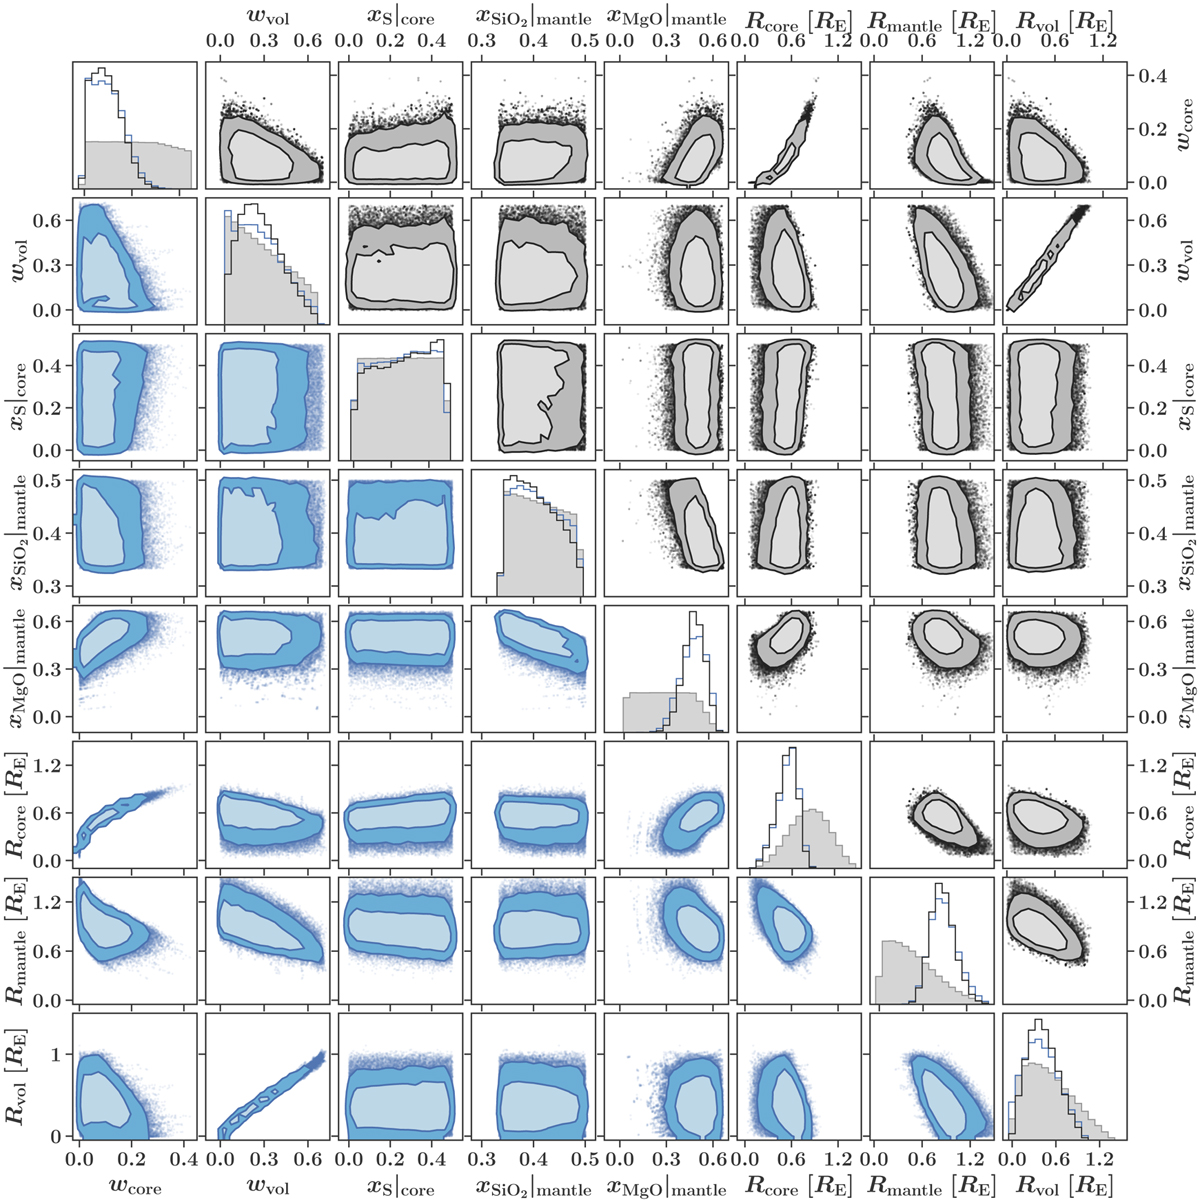
Comparison of the cINN and an MCMC method when applied to K2-111 b. The data in the lower triangle of each panel (blue points) were generated with the cINN method, and the data in the upper triangle (black points) were generated with the MCMC sampler. In the diagonal panels, we also show the marginalized prior probability (gray). The light shaded areas in the 2D diagrams indicate the 68% HDR, and the dark shaded areas are the 89% HDR.
Current usage metrics show cumulative count of Article Views (full-text article views including HTML views, PDF and ePub downloads, according to the available data) and Abstracts Views on Vision4Press platform.
Data correspond to usage on the plateform after 2015. The current usage metrics is available 48-96 hours after online publication and is updated daily on week days.
Initial download of the metrics may take a while.