Fig. 10.
Download original image
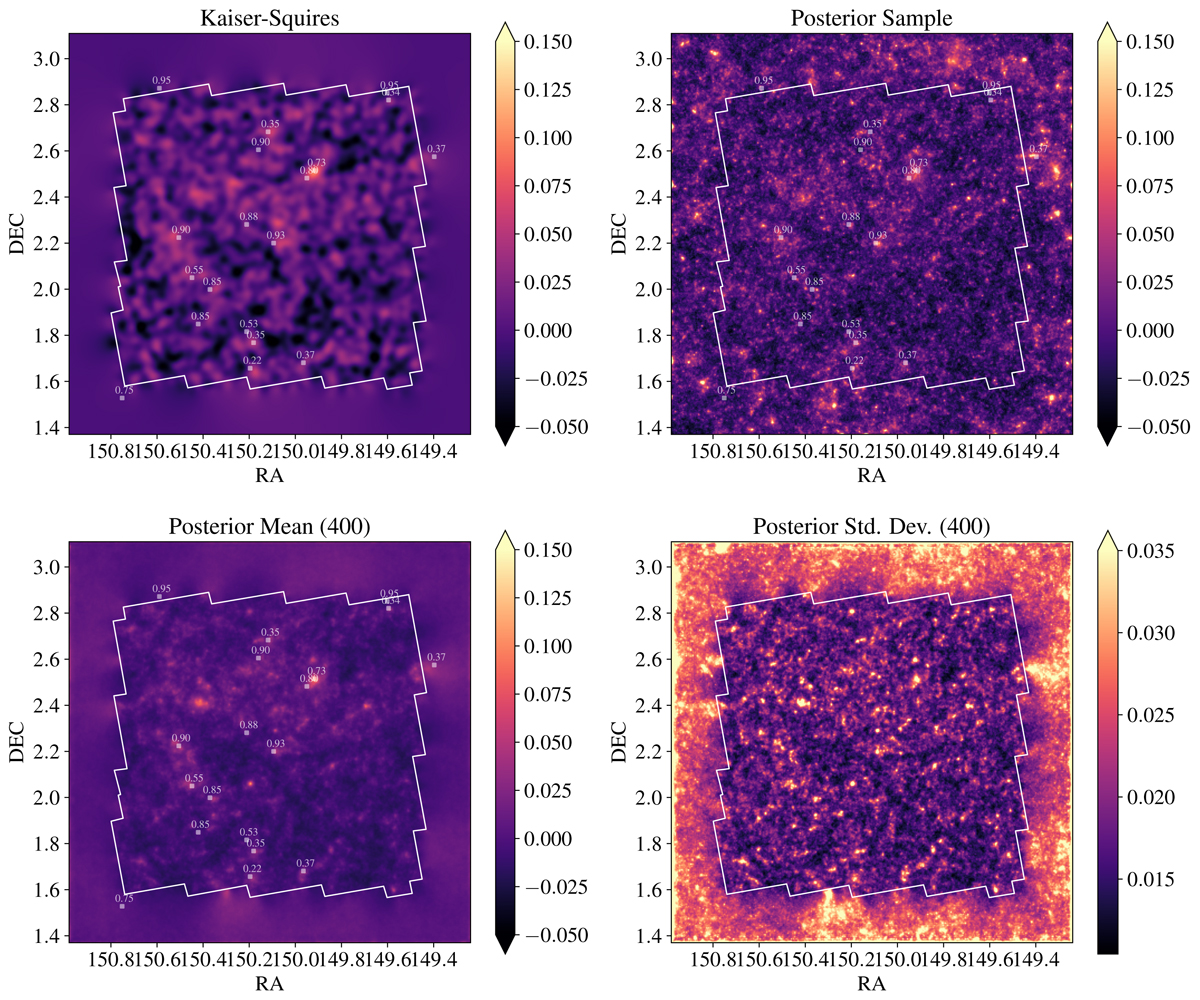
HST/ACS COSMOS field reconstructions along known X-ray clusters from the XMM-Newton survey. Top left: Kaiser–Squires (with a Gaussian smoothing of σ = 1 arcmin). Top right: sample from the posterior distribution. Bottom left: mean of the posterior distribution. Bottom right: standard deviation of the posterior distribution (over 400 samples, shown in the clipped range [0, 0.035]).
Current usage metrics show cumulative count of Article Views (full-text article views including HTML views, PDF and ePub downloads, according to the available data) and Abstracts Views on Vision4Press platform.
Data correspond to usage on the plateform after 2015. The current usage metrics is available 48-96 hours after online publication and is updated daily on week days.
Initial download of the metrics may take a while.