Fig. 5.
Download original image
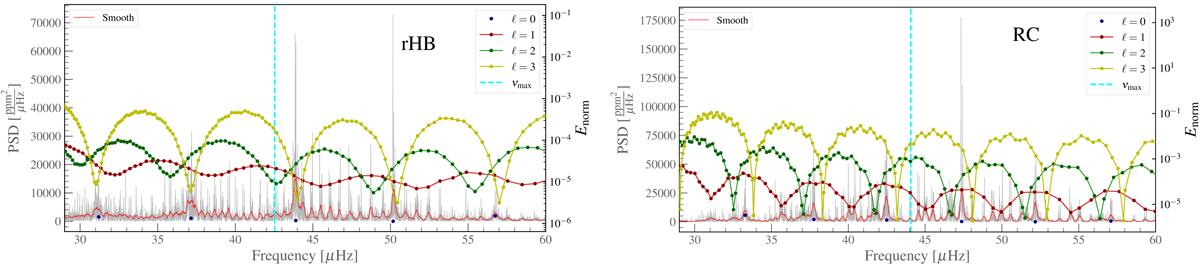
Simulated PSD (grey line) as a function of the eigenfrequencies using theoretical ℓ = 0, 1, 2, 3 modes for rHB (left) and RC (right) models. The red line is a smoothed version of the PSD. The vertical dashed cyan lines correspond to νmax values, and coloured dots and lines represent the values of Enorm for the ℓ = 0, 1, 2, 3 modes.
Current usage metrics show cumulative count of Article Views (full-text article views including HTML views, PDF and ePub downloads, according to the available data) and Abstracts Views on Vision4Press platform.
Data correspond to usage on the plateform after 2015. The current usage metrics is available 48-96 hours after online publication and is updated daily on week days.
Initial download of the metrics may take a while.