Fig. 3.
Download original image
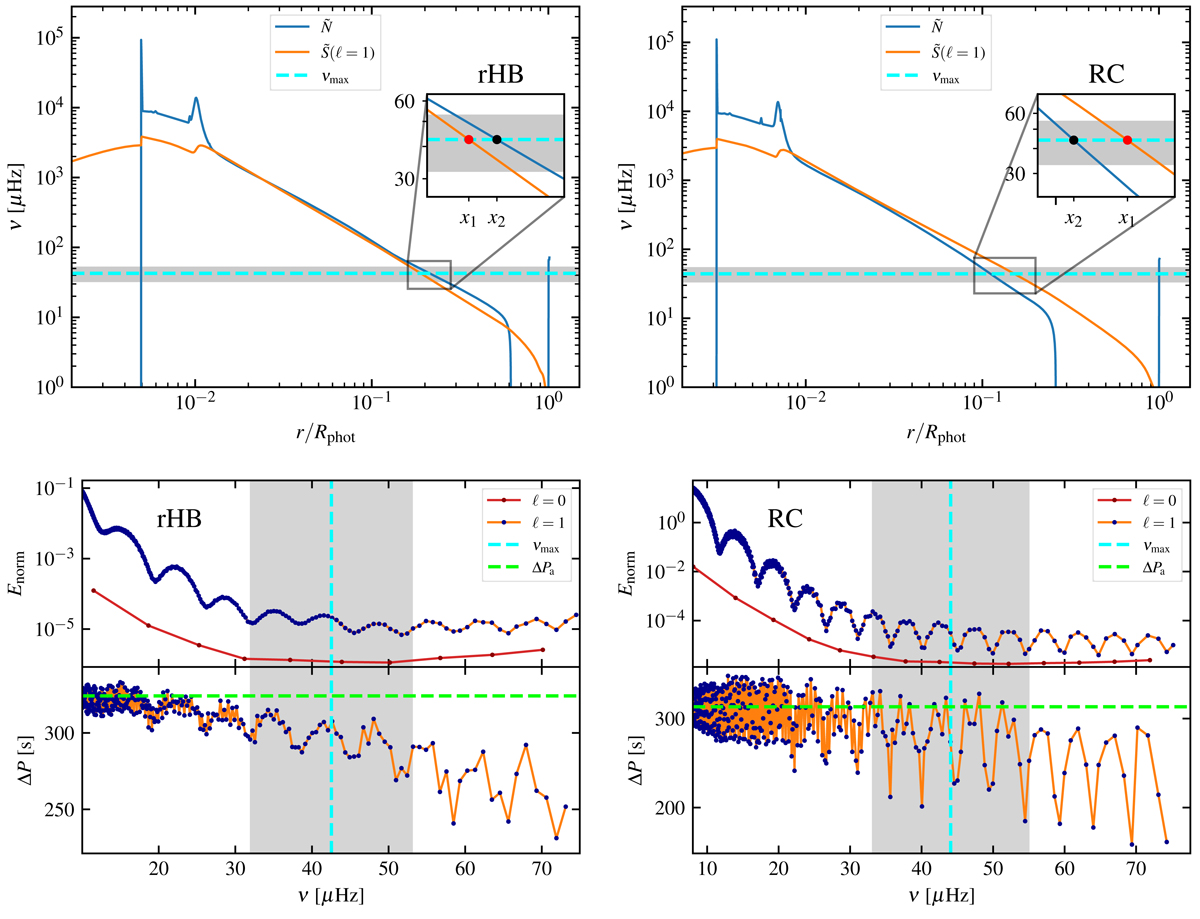
Comparison between structure and seismic properties of rHB (left panels) and RC (right panels) reference models (see Sect. 3). Upper panels: propagation diagrams of the dipole modes, with blue and orange lines corresponding to the modified Brunt–Väisälä and Lamb frequencies (Takata 2006), respectively. The grey bands represent the frequency domain of expected solar-like oscillations, and at their centre the dashed cyan lines indicate the νmax values. The insets are zoomed-in views of the evanescent zones, delimited at νmax by the red and black points. Their different extension translates to a different coupling between g and p cavities (see main text). Lower panels: normalised inertia, Enorm, and period spacing of the dipole modes, ΔP, as functions of the eigenfrequencies, with the red curve representing, for comparison, the Enorm of radial modes. The dashed green line indicates the value of the period spacing from the asymptotic theory of high-order g modes (ΔPa; Tassoul 1980), and the grey band and the dashed cyan line have the same meaning as in the upper panels.
Current usage metrics show cumulative count of Article Views (full-text article views including HTML views, PDF and ePub downloads, according to the available data) and Abstracts Views on Vision4Press platform.
Data correspond to usage on the plateform after 2015. The current usage metrics is available 48-96 hours after online publication and is updated daily on week days.
Initial download of the metrics may take a while.