Fig. 2.
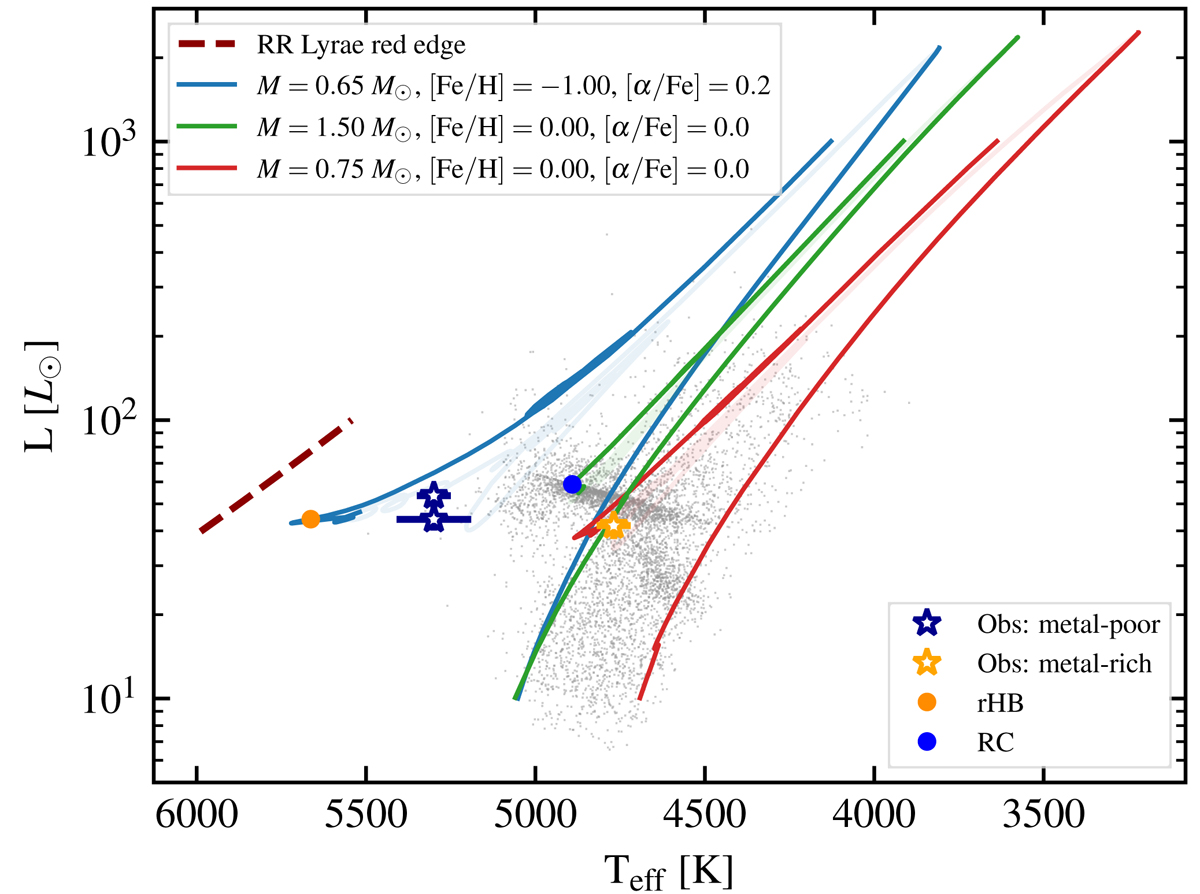
Download original image
HRD of a sample of red giants in the Kepler field. The coloured star symbols highlight the location of the first three rHB candidates in Table 1, and the grey dots in the background correspond to the Kepler-APOGEE sample in Miglio et al. (2021). The blue and red lines represent the theoretical red giant evolutionary tracks (from the RGB phase until the first thermal pulse) of low-mass stars with two different chemical compositions: M = 0.65 M⊙, [α/Fe] = 0.2, [Fe/H] = −1.00 (blue) and M = 0.75 M⊙, [α/Fe] = 0, [Fe/H] = 0 (red). The green line is the evolutionary track for a 1.5 M⊙ with solar composition, and the dashed red one is the red edge of the RRL-IS for the composition of the blue track (see Marconi et al. 2015). Solid orange and blue circles correspond to our rHB and RC reference models, with a central He mass fraction Yc ≃ 0.27.
Current usage metrics show cumulative count of Article Views (full-text article views including HTML views, PDF and ePub downloads, according to the available data) and Abstracts Views on Vision4Press platform.
Data correspond to usage on the plateform after 2015. The current usage metrics is available 48-96 hours after online publication and is updated daily on week days.
Initial download of the metrics may take a while.