Open Access
Fig. 5.
Download original image
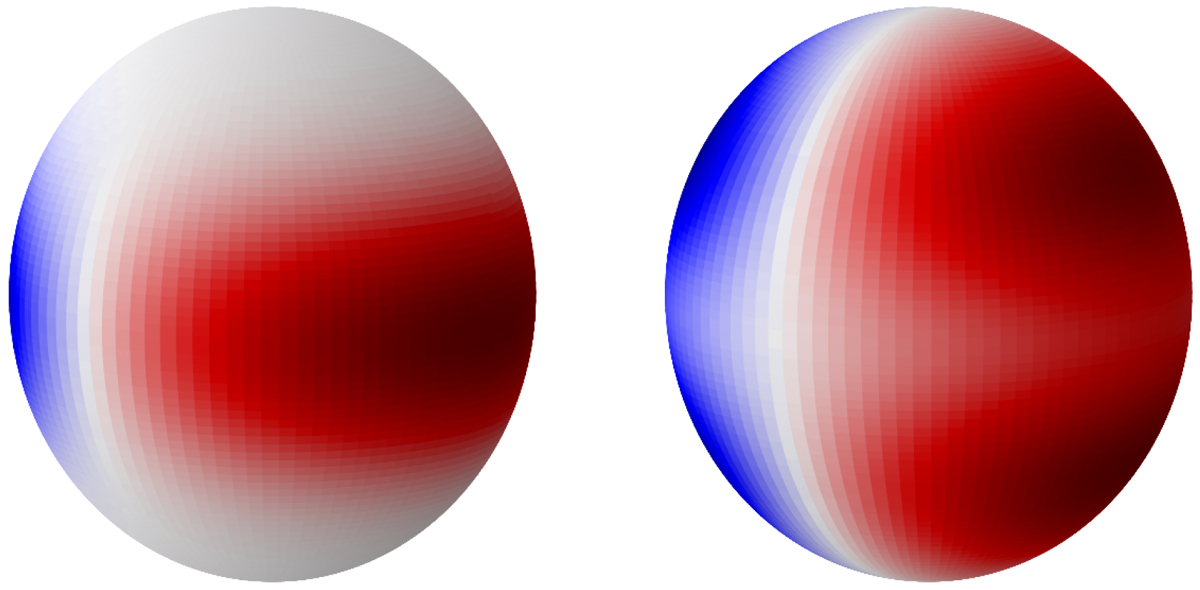
Geometries of the dominant (k, m) = (0, 1) g mode (left) and (k, m) = (−2, −1) r mode of KIC 3341457 (right), ignoring the effects of tidal deformation and perturbation. Regions on the stellar surface where the pulsations cause the temperature to decrease (increase), are indicated in red (blue).
Current usage metrics show cumulative count of Article Views (full-text article views including HTML views, PDF and ePub downloads, according to the available data) and Abstracts Views on Vision4Press platform.
Data correspond to usage on the plateform after 2015. The current usage metrics is available 48-96 hours after online publication and is updated daily on week days.
Initial download of the metrics may take a while.