Fig. 2.
Download original image
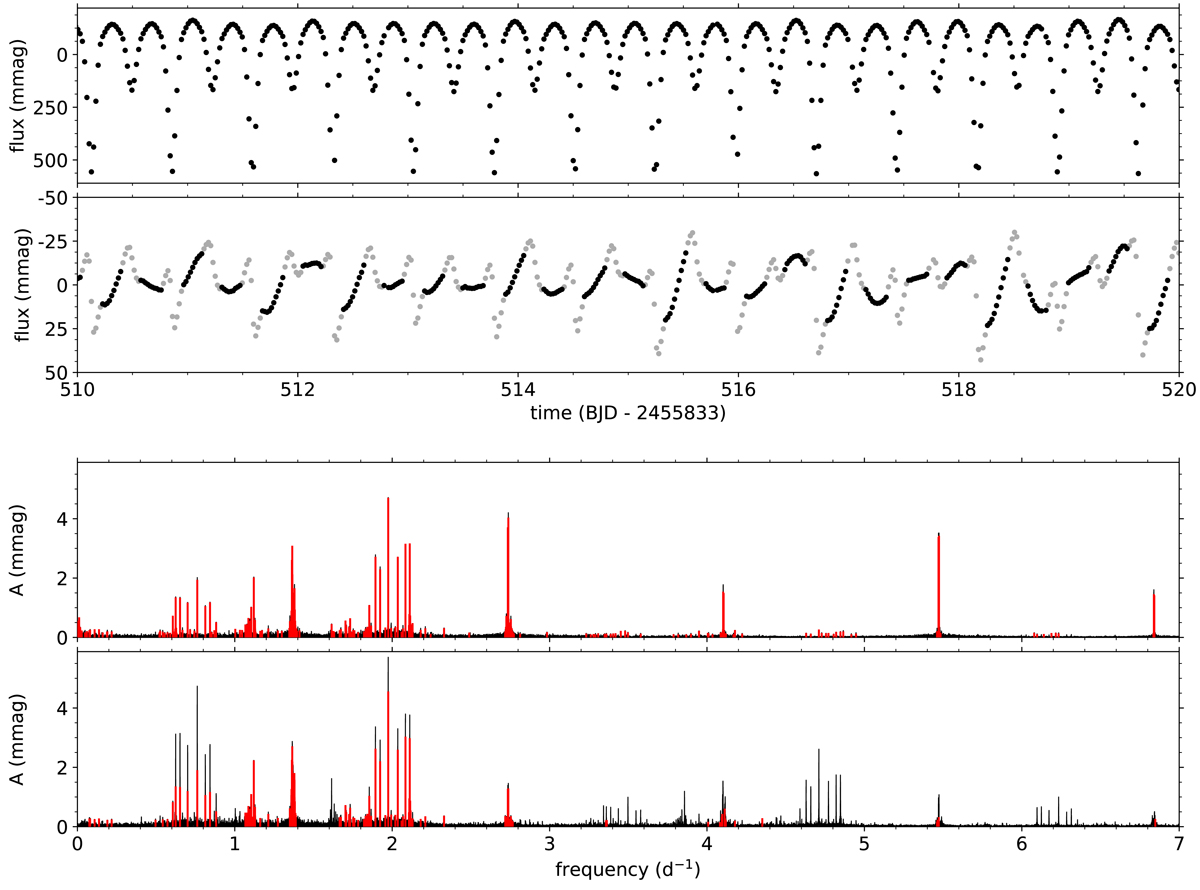
Different steps in the pulsation analysis of KIC 3228863, which is one of the stars in our sample. Top: part of the reduced Kepler light curve. Second panel: part of the pulsation light curve, calculated by subtracting the harmonic model from the light curve, with the eclipses and the out-of-eclipse parts shown in grey and black, respectively. Third panel: Lomb-Scargle periodogram of the full pulsation light curve (black), with the pre-whitened frequencies (red). Bottom: Lomb-Scargle periodogram of the out-of-eclipse parts of the pulsation light curve (black), with the pre-whitened frequencies (red).
Current usage metrics show cumulative count of Article Views (full-text article views including HTML views, PDF and ePub downloads, according to the available data) and Abstracts Views on Vision4Press platform.
Data correspond to usage on the plateform after 2015. The current usage metrics is available 48-96 hours after online publication and is updated daily on week days.
Initial download of the metrics may take a while.