Fig. 5
Download original image
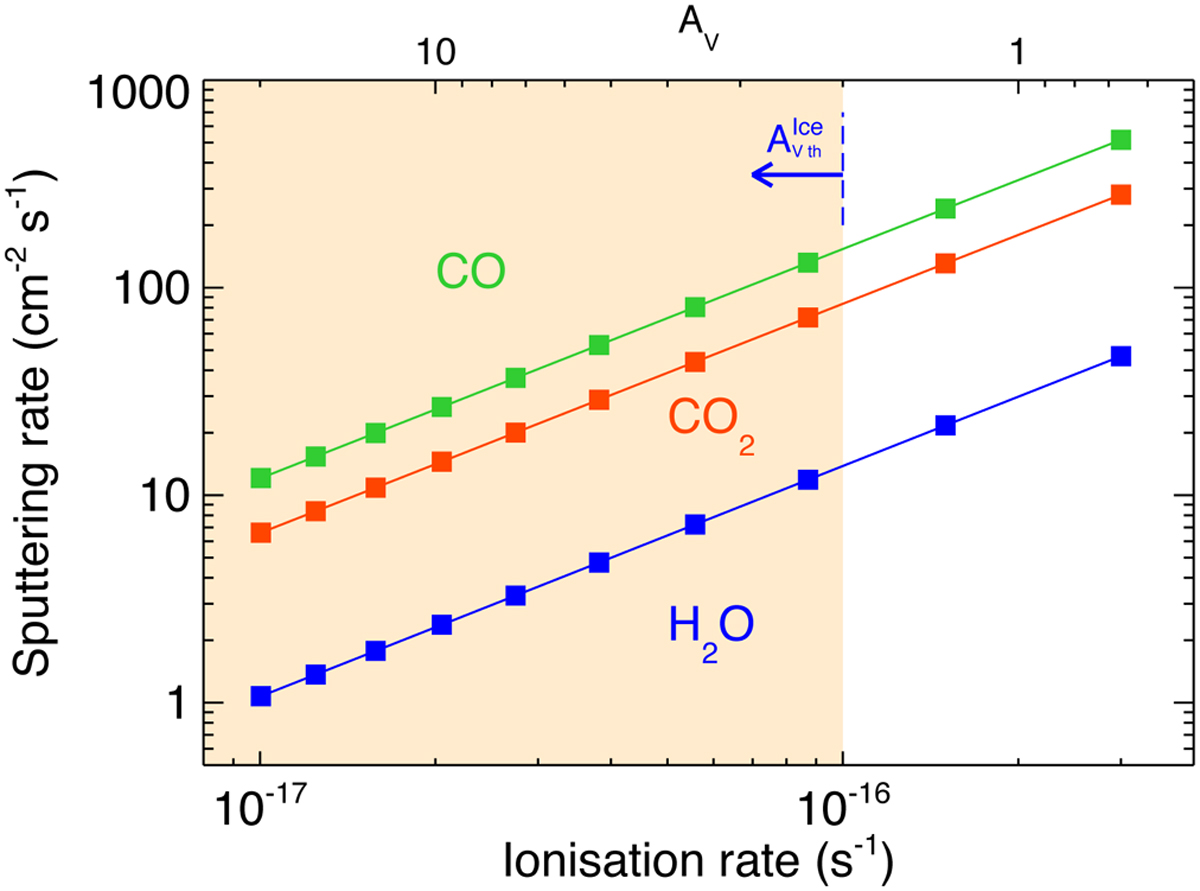
Sputtering rate as a function of ionisation rate for H2O (blue), CO2 (red), and CO (green). The upper abscissa axis represents the approximate relation established between observed ionisation rate and the inverse of the visual extinction (e.g. Neufeld & Wolfire 2017). The arrow is shown to stress the fact that ices only appear above a visual extinction threshold (dependent on the particular dense cloud). This sets an upper limit to the maximum ionisation rate for dense cloud regions where they reside. The ionisation rate cannot be set arbitrarily high, even close to a strong source, as the cosmic rays spectrum is propagated (and therefore low energies attenuated) at least within a column density of matter corresponding to this minimum threshold AV.
Current usage metrics show cumulative count of Article Views (full-text article views including HTML views, PDF and ePub downloads, according to the available data) and Abstracts Views on Vision4Press platform.
Data correspond to usage on the plateform after 2015. The current usage metrics is available 48-96 hours after online publication and is updated daily on week days.
Initial download of the metrics may take a while.