Fig. 2
Download original image
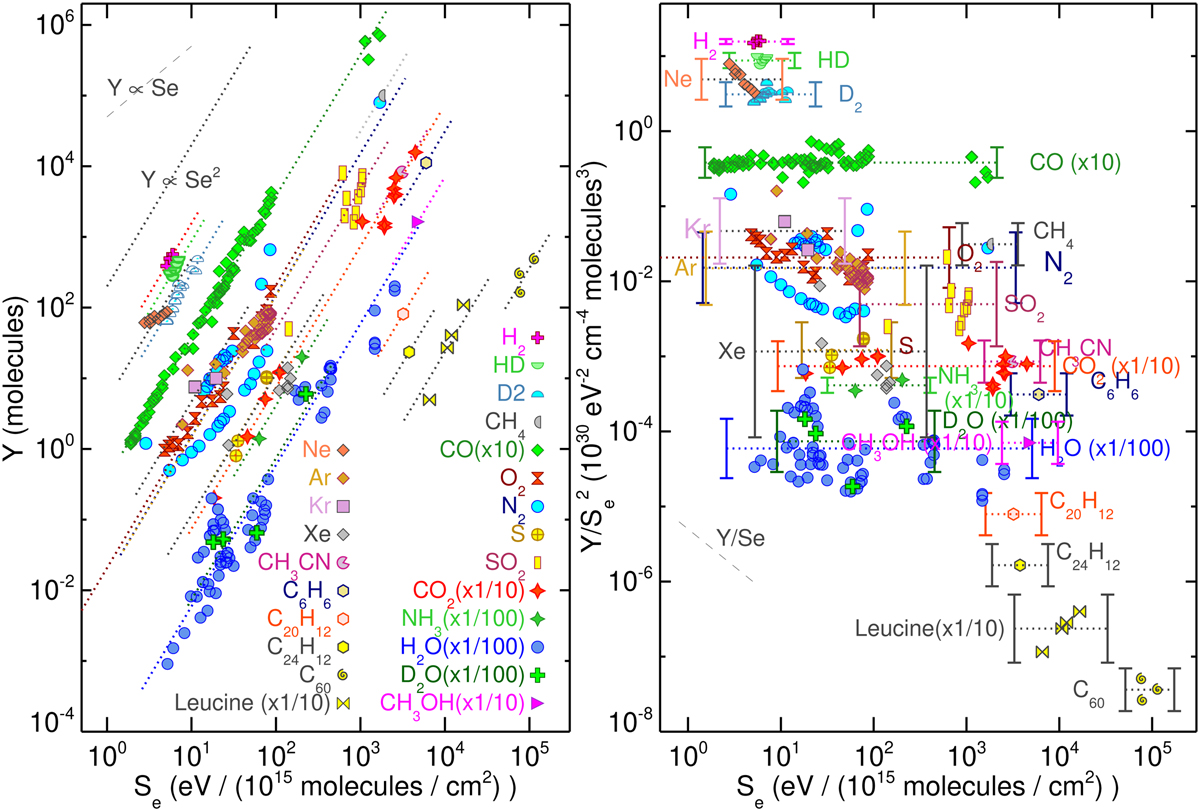
Left: compendium of the sputtering yields Y obtained from the literature as a function of the electronic stopping power Se, to which are added our recent N2 measurement. The upper left dashed and dotted lines show the expected behaviour if the sputtering evolves linearly or quadratically, respectively, with the stopping power. The quadratic fit to each set of data for molecular systems and rare gases is over-plotted with dotted lines for comparison. Right: same data, assuming a quadratic dependency of the electronic sputtering yield on the stopping power, i.e. dividing the yield by Se2. Under this representation, a quadratic behaviour appears as a flat line, represented with dotted lines, and allows us to derive the sputtering yield prefactor ![]() . The error bars on the calculated prefactor for each species are shown. The lower left dashed line indicates the expected behaviour in the case where the sputtering dependency on the stopping power is linear.
. The error bars on the calculated prefactor for each species are shown. The lower left dashed line indicates the expected behaviour in the case where the sputtering dependency on the stopping power is linear.
Current usage metrics show cumulative count of Article Views (full-text article views including HTML views, PDF and ePub downloads, according to the available data) and Abstracts Views on Vision4Press platform.
Data correspond to usage on the plateform after 2015. The current usage metrics is available 48-96 hours after online publication and is updated daily on week days.
Initial download of the metrics may take a while.